April 18, 2023
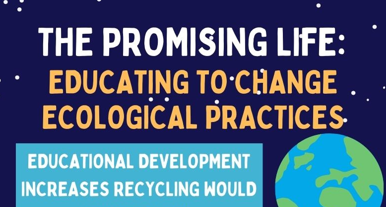
The Promising Life: Educating To Change Ecological Practices

Tags from the story
Laudato Si Goals
Nomination-Civic-Engagement-and-Social-Action
Recent Comments
Eduardo Saucedo Moreno
Hello! I really liked your infographic. It had a lot of images and it is very easy to understand. However, What I would have done different is that I would have implemented less pictures and more text only because it can be better to understand an image if you have text to back it up. Overall, Good infographic, but again, I would have implemented more text to it just for the audience that prefers to read more than to see images trying to explain the topic being discussed.
15/10/2023
7:51 pm
Eduardo Saucedo Moreno
Hello! Really good job with this infographic. This topic is rated to Civic Engagement because educating a community on how to take better care of our planet requires the contribution of many individuals. Therefore, you cannot be able to educate such a big community with only a limited amount of oppose willing to teach. Something that stood out to me about this presentation was the use of images but what I would maybe have improved is implementing more text rather than images. It felt too unbalanced for me.
15/10/2023
7:51 pm
Andrew Ramon
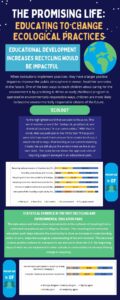
Wow, I think your graphic presents a lot of data and facts in an digestible way. That’s a lot of studies and points to present, but it was done so without being overwhelming. It’s very clear the impact of living green will have on bettering our environment and providing more education on the topic is the key to being more effective. I really like the color scheme in this, they all go together with the globe and space theme. The charts were easy to read and everything tied together very well.
15/10/2023
7:51 pm
Maria Guerrero
The thoughtful design and organization of the information you are offering is the first thing that immediately stands out to me. This essay caused me to think about what I am doing and how I can be a more active young individual. In order to make decisions and go on with processes, it is crucial to be informed and educated and this article is helping with that. Great work!
15/10/2023
7:51 pm
Linda Aguilar
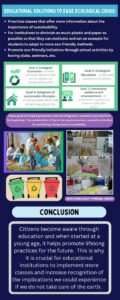
Congratulations on the nomination! The information was informative and easy to read. The color schemes were an excellent choice for demonstrating statistical information. The photographs were a great choice, it allowed the audience to easily interpret solutions for positive change. Overall, the entire infographic inspired me to start making changes in my daily life This information allows people to be more resourceful.
16/10/2023
7:51 pm
Fernando Garza
This is a very-well detailed infographic with heaps of information. Firstly, I very much enjoyed the layout and color choice for the design, as it was very much eye-catching and made following along feel seamlessly. Secondly, the topic being discussed is a very relevant issue at hand, and the approach to create a solution is a very-well thought out idea. Lastly, the narrative flow that is used here is well done. There is a great mixture of the core message as well as statistical data being used here.
16/10/2023
7:51 pm
Bella Cortez
I loved your infographic! I thought it was so artistic. I really loved the space theme at the top of your infographic. I thought your color palette was on point. I Did think there were a lot of words, but they flowed really well. I thought the images you used were perfect for this assignment. I would for next time add more symbols and images to capture your audience more.
18/10/2023
7:51 pm
Alexis Silva
I really liked your infographic as it appeals to the eye with the vibrant colors and neat pictures. I appreciate the use of the table, however I would recommend creating a new section explaining the data and what it means. The last section does a really good job at stressing the importance of educating others on changing our ecological practices.
10/12/2023
7:51 pm
Mikayla Trejo
This info graphic was eye-catching and provided a wave for the future of our society to be in a better place than it is now. The sentiment is relevant and appreciated, considering where society is now. To inform the youth ecology is a creative way to ensure sustainability in the future. Thank you for touching on such a crucial topic.
11/12/2023
7:51 pm


Lauren Sahadi
I loved the visual aspects of the infographic. My favorite part of the information was the data that was given. It was a nice element that gave information quickly and supported the data. The subject matter was important and the information given was enough to understand your points, but not too much to where I don’t want to read it all.
15/10/2023
7:51 pm