

How State-Led Development Policy Drives Economic Recovery in Post-Conflict States: An Empirical Analysis of Rwanda’s Poverty Reduction After The 1994 Genocide
Poverty Rate in Rwanda (2001-2017)
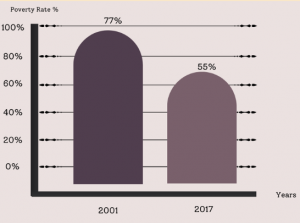
The 1994 genocide launched Rwanda’s economic reconstruction. As a result, poverty declined as a sign of transformation. The data illustrate that the poverty rate drops 22 points over 16 years due to Rwanda’s state development. A drop in poverty for social stability and sustainable peace in Rwanda
- Programs such as agricultural modernization, social protection, and institutional reconstruction were implemented during the same period that poverty declined most sharply.
- The measurable improvement from 77% to 55% provided evidence of government effectiveness, helping rebuild public trust, stabilize institutions, and support long‑term recovery after the genocide.
- Government‑driven reconstruction, social protection programs, and institutional rebuilding formed the foundation of economic stabilization.
Cite: Dawson, Neil M. 2018. “Leaving no one behind? Social Inequalities and Contrasting Development Impacts in Rural Rwanda.” Development Studies Research


3 comments
Mía Perez
I like this article because it clearly shows how Rwanda’s recovery after the genocide was shaped by strong government-led policies. I really enjoyed how you connected poverty reduction to specific programs like agricultural reform and social protection, since it made the economic changes feel real and measurable. It helped me understand how rebuilding institutions can directly improve people’s lives over time. The focus on long-term stability and trust in government stood out to me as especially important.
Elijah Perez
Ila, great presentation and summary about the transformation of Rwanda’s poverty rate decrease. It is extremely monumental and powerful how the Rwandan people and government were able to overcome such an adversarial divide, which has subsequently led to a revitalized nation altogether. Rwanda’s ability to recover from such a devastating period and implement effective development strategies really highlights how intentional governance and long-term planning can reshape a country’s trajectory.
However, I would recommend one way to strengthen your infographic further would be to include a more detailed, year-by-year breakdown of the poverty rate. This would allow for a clearer connection between changes in the data and specific political or economic developments, such as state-led policies, institutional reforms, or investment strategies. By linking those shifts more directly to political economy factors, your analysis could go beyond showing the trend to explaining what drove the decline over time. Overall, I appreciate your infographic and presentation highlighting this transformative era for Rwanda.
Paul Jones
Ila
This powerful infographic illustrates Rwanda’s reduction in poverty in the 21st century. It brings optimism and hope to countries who have experienced significant tragedies. Indeed, effective governments can restore public trust, stabilize institutions, and rebuild economies.
It might be interesting to build upon this data in a couple of ways to more clearly tell the story of Rwanda’s recovery. Perhaps showing poverty rates every year, either with a bar graph or a line graph, to show annual changes and trends over the reported period of time would be informative. Additionally, it would be interesting to couple this data with key dates when specific government initiatives were implemented, thus showing specifically what programs in particular may have had the most significant impact on the reduction in poverty.
Your comments on Rwanda’s economic reconstruction is undoubtedly spot on, and I appreciate the cited reference. Capturing these key facts into an infographic, say for instance the amount of money invested in agricultural modernization, or the numbers of social protection programs implemented, could powerfully illustrate the connection between exactly what efforts contributed most to the recovery, and what can be done to keep the strong trend moving in a positive direction to achieve a complete reduction in poverty.
Thank you for researching this topic and presenting your findings. Very well done.
No AI was used.