April 5, 2022
Allergies Explained: Symptoms, Impact, and Solutions

Tags from the story
allergies
Public Health and Medicine
Recent Comments
Matthew Gallardo
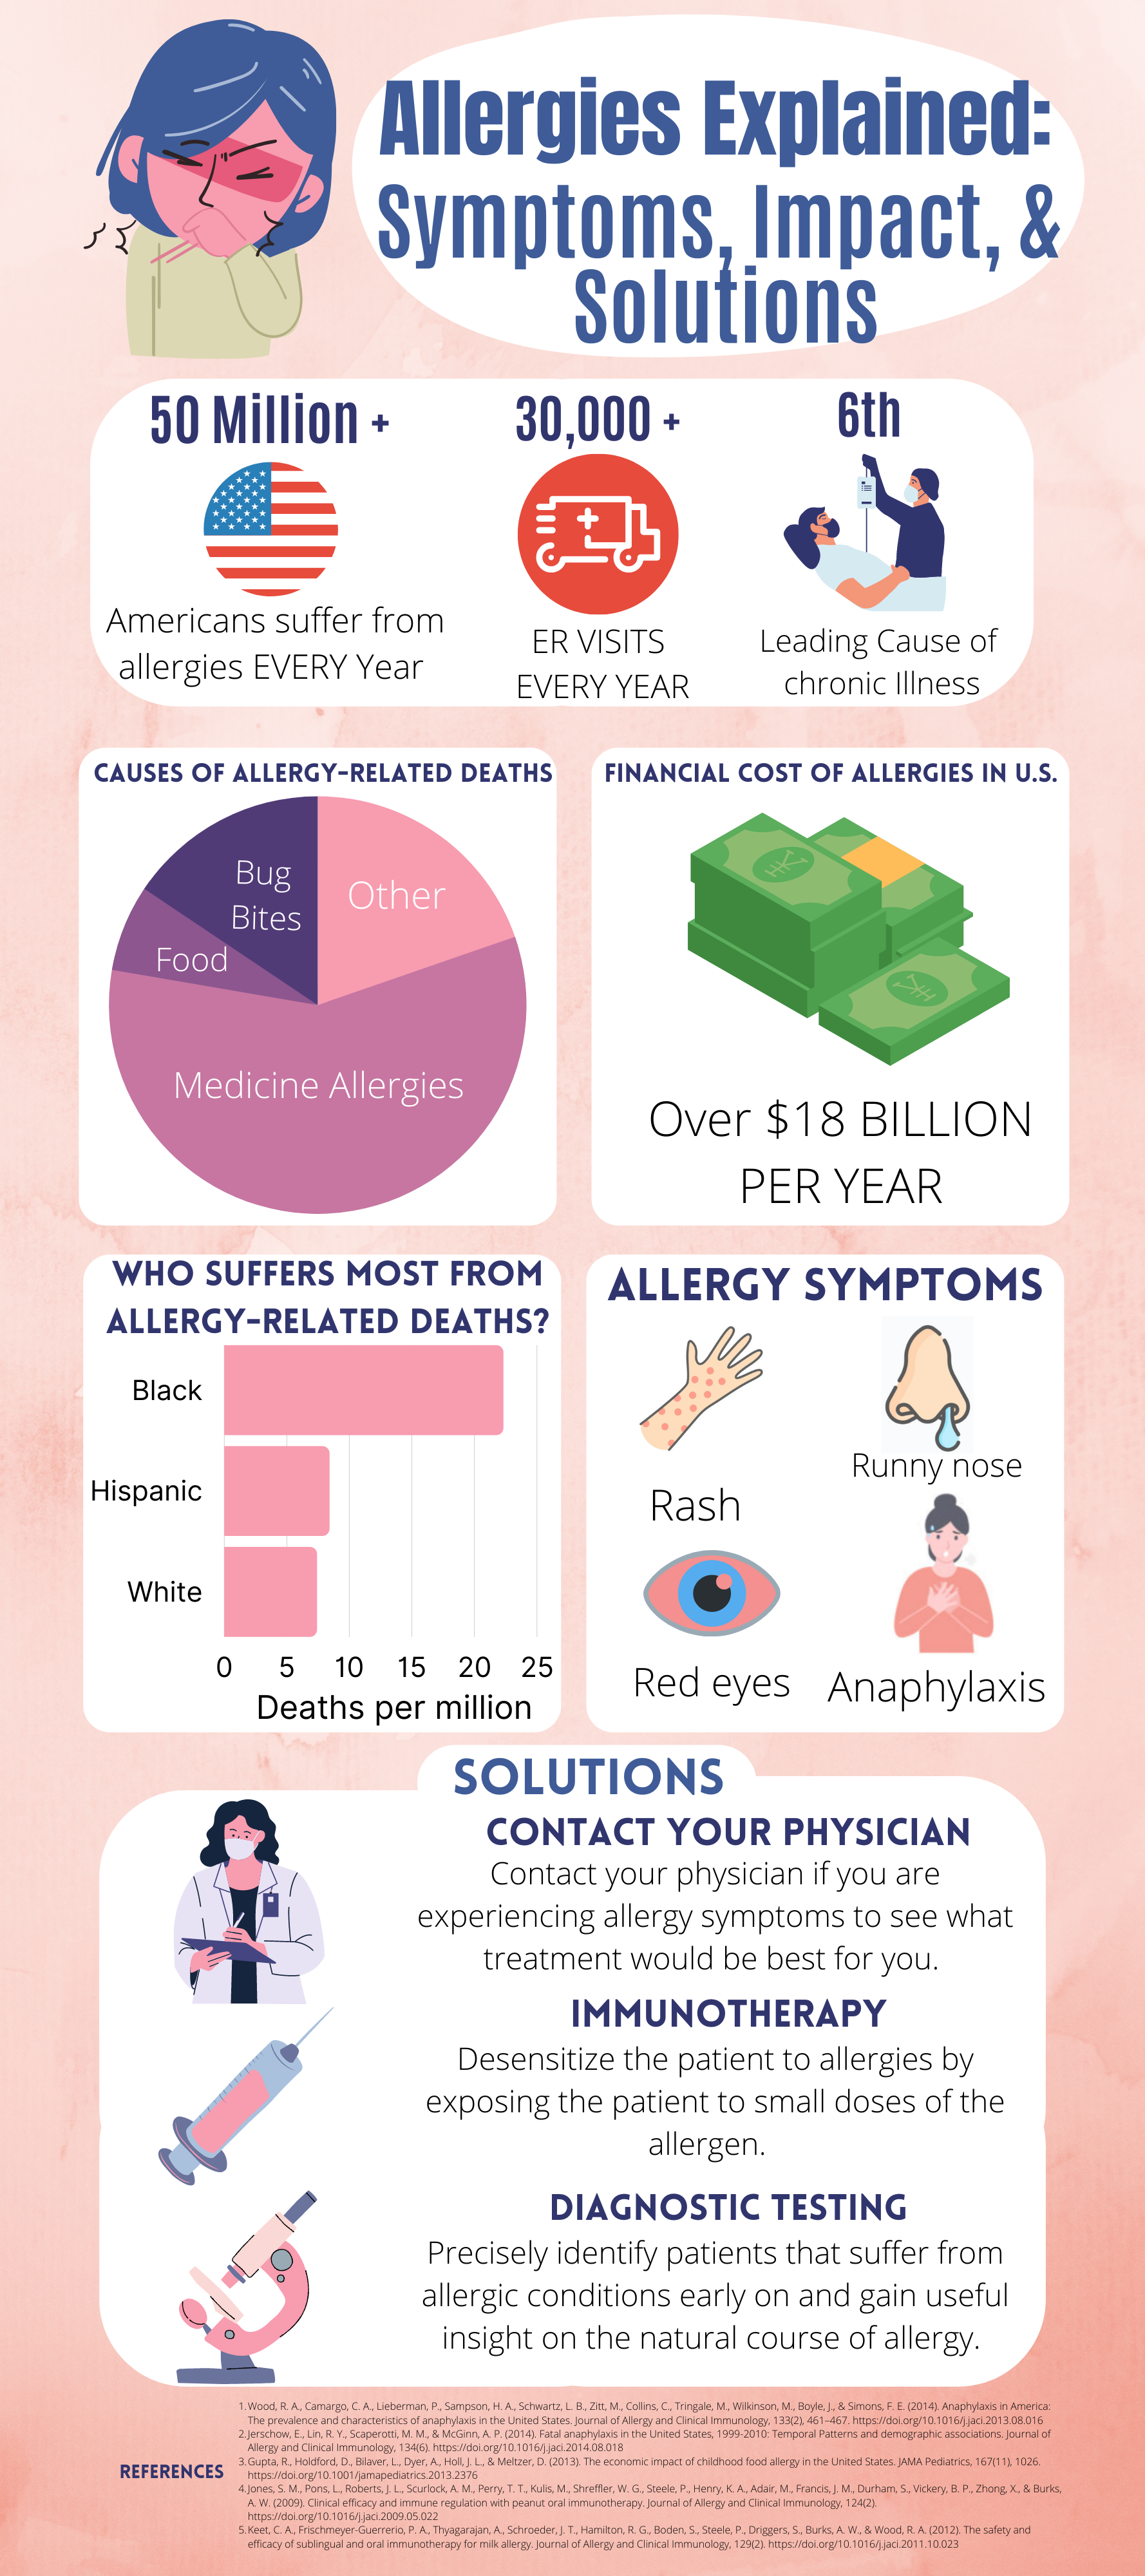
This is the first time I’ve read an article in this format, and I am please to have done so. the information was very easy to read, and it was straightforward as well as simple. I had no idea how much money allergies takes per year in the United States. Short, to the point, and visually pleasing, I really like this article!
26/04/2022
4:50 pm
Paula Ferradas Hiraoka
Hello Adrian, First of all, congratulations on your nomination and getting your infographic published! I always had the confusion of seasonal allergies and immunity allergies, so your infographic helped me a lot to differentiate that, now I know they are not the same thing. I never understood medical concepts but your work helped me clarify a lot! Also, the design, fonts, and the color helped a lot for the reader and it’s eye-catching. Overall, amazing work and good luck!
26/04/2022
4:50 pm
Margaret Maguire
I really like the infographic you made. Also congratulations on getting nominated for an award. I thought the fact about bug bite related reactions cause more death than food related reactions was really interesting. I thought food allergies deaths would be biggest case of allergy related death but it is actually medicine based reactions. Wonderfully made infographic and easy to read.
27/04/2022
4:50 pm
Anissa Navarro
I had never known allergies affect so many people, I also have never been the type to take them completely seriously though. When I think of myself having allergies I kind of just take a Benedryl and let it run its course. That is just how I had always treated allergies. It is nice to know how much it affects people and what I could do about it.
27/04/2022
4:50 pm
Cecilia Schneider
I never realized just how important allergies were. I understood that many were affected, but I did not understand to what lengths allergies impacted people around me. To see the lives affected has opened my eyes and understanding. Overall, this looks very clean and honestly pleasant to view! Congrats on the publication and nomination!
27/04/2022
4:50 pm
Celeste Pérez González
Adrian, great infographic! It was easy to follow and its design is great! I didn’t know that over 50 million Americans suffer from allergies every year. That number was really shocking to read. In your pie chart, there is a large portion labeled as “other” for causes of allergy-related deaths, I’m curious, what would those other causes be? Great work!
29/04/2022
4:50 pm
Jesslyn Schumann
Hello Adrian! This was a great infographic to follow! With allergy season starting to hit its peak, it is so important for people to become aware of the dangers they could face and how they could solve them. It was interesting to see that some minorities were more likely to succumb to allergy related deaths than anything else. Good luck with the award ceremony!
30/04/2022
4:50 pm
Grace Malacara
Your infographic has a nice, simple design. The colors and visuals are highly attractive, and the material offered provides excellent insight and knowledge on allergies. I also believe that most individuals are uncertain of what to do if someone has a severe allergic response. This is an excellent essay for raising awareness; well done! Congratulations on your nomination!
01/05/2022
4:50 pm
Sophia Phelan
Your graphics were so cool! I learned so much and didn’t feel overwhelmed by the amount of information or how it was presented.
03/05/2022
4:50 pm
Carlos Hinojosa
I never really understood the difference between seasonal allergies and immunity allergies so this actually helped quite a bit since I never knew that they were actually the same thing. To be honest I wasn’t or haven’t really been taught that much about allergies except the one I do have which suck. But this infographic did a terrific job at explaining how they work and how to treat them. Very good article? I guess.
09/04/2022
4:50 pm