
INTRODUCTION
In Texas water conservation is an important topic, not just because of the arid nature of the state, but also due to the cultural significance certain bodies of water hold to communities they have helped build over Texas’ history. One of the biggest consumers of Texas water are its inhabitants of large cities based on survey data from the Texas Living Waters project, citing that “more than half” of metered municipal city water was delivered to residential customers in 20191. One of the biggest challenges faced by these city’s public water utilities has been identifying what factors cause some communities and customers to use more water than expected, and given the high costs associated with excess pumping2, it would be fair to assume that higher income customers would use more water. The purpose of this study was to use GIS to identify if there was any discernible correlation between income level and water consumption in Texas cities, with the assumption being that higher income levels result in more water being consumed.

Income was chosen as the independent variable from a logistical standpoint that higher income customers would not only have more property to supply water to, but also be able to pay the higher bills that would come with the excess pumping. A 2017 study on the San Francisco Bay by Stanford University identified that income rates in the region had increased over time alongside water consumption, citing it as a possible contributing factor4. Although the Gonzales and Newsha (2017) study found there to be other factors influencing the rising consumption, the present study focused on the fifty largest cities in Texas as test subjects to determine if a similar pattern was present.
The cities chosen were selected as the fifty Texas cities with the highest population based on data collected by the 2021 American Community Survey5. These cities were selected because their larger populations required better records to be kept of water consumption by the public water utilities, providing more accurate data. The cities consumption’s could be accessed from the interactive water surveys collected by the Texas Water Development Board as reported from each city’s public water system6. Income records were available from the Texas Water Development Board and showed median income averages for every city in Texas7. The records for 2021 were used for this research, as it was the most current year for both these surveys and provided the most up-to-date information.
The data on income and water usage was input into an excel spreadsheet that was joined in ArcGIS Pro to an existing cities shapefile obtained from the Texas Department of Transportation’s website8.
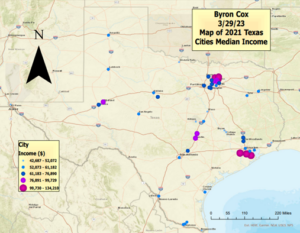
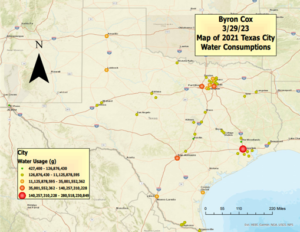
Figures 1 and 2 display the data used for this analysis, water usage and income for the fifty selected cities across Texas.
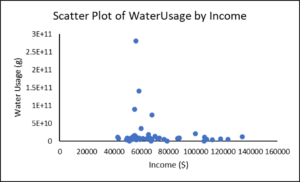
A Pearson Correlation Coefficient test in SPSS was used to determine if there was a correlation between income and water usage9.
RESULTS
From the GIS maps generated in Figures 1 and 2, a negative relationship is present between the income and usage factors displayed, where as income increased in areas, water consumption levels decreased. The results of the Pearson Correlation Coefficient test yielded an r-value of -0.140, which indicated that there was a weak negative correlation between water usage and income, but this correlation was not significant (p=0.33). Due to the lack of significance, the original hypothesis can be rejected. As seen in Figure 3, water usage decreased as income increased.
CONCLUSIONS
The original hypothesis posited that higher-income customers would consume more water because they would be more likely to buy larger, more water-consuming properties in terms of yard size and have an interest in maintaining an aesthetically pleasing yard. While they may have the excess money to do so, lower income properties would not have the extra money to make their yards a priority or have larger homes that contain more water-hungry appliances. However, based on the results an alternate explanation could be that higher income allowed people to use less water because they may have access to more recent low-flow and water-efficient devices, while lower-income customers were more susceptible to leaks and water contamination and could not afford to invest in water-efficient devices.
This research was able to determine that higher income levels did not correspond with higher water usage as expected for the 50 largest cities in Texas. A potential next step from this study would be to determine if water-saving technologies and programs are equally accessible to residents, regardless of income level, in addition to improving the infrastructure conditions in lower-income cities. Many Texas water utilities are offering free water-saving incentives to their customers through rebates or billing rewards, but what is unclear is if lower income areas have access to these messages or the ability to purchase the water-saving devices even if a rebate is available10. These rebates and incentives are good first steps towards making water conservation more accessible to the general customer, but we need to ensure that access to internet, television, or transportation are not limitations to lower income customers taking advantage of these programs.
- Lake, Peter, Kathleen Jackson, Brook Paup, and Jeff Walker. Rep. Water Use of Texas Water Utilities 2020 Biennial Report, January 1, 2021. https://www.twdb.texas.gov/publications/reports/special_legislative_reports/doc/2021_WaterUseofTexasWaterUtilities.pdf. ↵
- Redin, Jacquelin. “Water & Wastewater Survey.” Texas Municipal League. Accessed April 4, 2023. https://www.tml.org/229/Water-Wastewater-Survey-Results. ↵
- Wonderlane. “Sweet Northern Californian House, Expensive Neighborhood, San Mateo, San Francisco Bay Area, California, USA.” Flickr. Yahoo!, February 24, 2009. https://www.flickr.com/photos/wonderlane/3305448096. ↵
- Gonzales, Patricia, and Newsha Ajami. “The Changing Water Cycle: Impacts of an Evolving Supply and Demand Landscape on Urban Water Reliability in the Bay Area,” August 2017. https://www.researchgate.net/publication/318970820_The_changing_water_cycle_impacts_of_an_evolving_supply_and_demand_landscape_on_urban_water_reliability_in_the_Bay_Area. 6-7 ↵
- “Texas Cities by Population.” Texas Outline. United States Census Bureau, December 8, 2022. https://www.texas-demographics.com/cities_by_population. ↵
- “Texas Water Development Board.” Historical Water Use Survey Data | Texas Water Development Board. Accessed March 30, 2023. http://www.twdb.texas.gov/waterplanning/waterusesurvey/dashboard/index.asp. ↵
- “Texas Water Development Board.” Historical Water Use Survey Data | Texas Water Development Board. Accessed March 30, 2023. http://www.twdb.texas.gov/waterplanning/waterusesurvey/dashboard/index.asp. ↵
- “Texas Cities.” TxDOT Open Data Portal. Accessed March 30, 2023. https://gis-txdot.opendata.arcgis.com/datasets/993d420b9f0742b9afa06622d27a37e0_0/explore?location=31.414716%2C-99.432831%2C6.00. ↵
- “Libguides: SPSS Tutorials: Pearson Correlation.” Pearson Correlation – SPSS Tutorials – LibGuides at Kent State University. Accessed March 31, 2023. https://libguides.library.kent.edu/spss/pearsoncorr. ↵
- “San Antonio Water Conservation Programs Ease Strain on Low-Income Households.” American Water Works Association, November 7, 2019. https://www.awwa.org/AWWA-Articles/san-antonio-water-conservation-programs-ease-strain-on-low-income-households. ↵