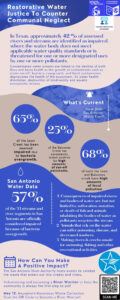
This infographic was both informative and visually appealing. The statistics on the percentage of impaired creeks were particularly striking. The design, especially the use of statistics, effectively highlighted the current state of this issue within our city. I appreciated how it also provided resources for those interested in making a difference.
I like this infographic. This infographic shows great results of san antonio Texas water pollution. The water is impaired easily with little bit of harmful material. I like this infographic because of it’s background color and the font of letter they showed. Thank you for the important issue and explained it well to us. Keep going on you guys work. I will support
This info graphic was extremely eye-catching while also being informative. Thank you for explaining an issue and a extensive manner while also being straightforward. I appreciate how you mentioned this issue and also provided solutions or Waze for the general population to help resolve or reverse this water crisis.
I love this infographic! The colors are pleasing and match the theme. The different size fonts help stress important information. I like the incorporation of the QR code as it symbolizes a point in technology we are in while providing information on how to be a river warrior. Overall, this infographic helps individuals realize a change is needed to protect our water sources.
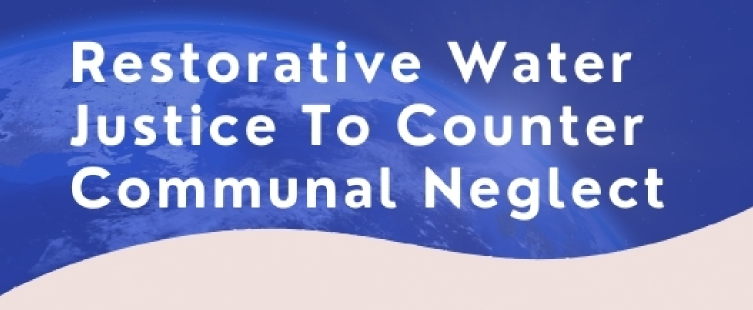
This infographic was very good. Particularly with its message and delivery. The intro explains in a very quick but detailed manner as to what its focus is on. Afterwards it further explains how this issue is something that affects us. The use of the design and especially the statistics was very-well done as it put on display front and center where we as a city are at in terms of this issue. I also liked how it provided where someone could go if they were wanting to make a change.
This infographic was informative and visually pleasing. The hand drawn flowers at the end of the infographic were beautiful and the color scheme of pastel blue and pink were an excellent choice. The information and percentage of the impaired creeks was shocking. The QR code to become a river warrior was an excellent idea and easy for the user to get more information. Great job!
Wow! This has been my favorite infographic by far! I believe it’s crucial to remember that, on occasion, we truly need something to attract our attention in order to pay attention, and this infographic is so appealing and lovely to look at. The fact that people take our water for granted and that it does not meet high standards surprises me given how commonplace it is is. Amazing work!
I really like the aesthetic of this graphic! I had no idea our water was impacted that much here in town, that is really interesting and a little gross. It’s sad for the wildlife that live in it. I do like how you provided a way to help and even included the QR code to scan that would bring up the page on how to be a river warrior. That is a really effective and simple way of increasing engagement. Excellent idea.
Really good job with this infographic. This topic relates to Civic Engagement because we as a community need to ensure that our environment and, in this case, our rivers, have clean water so it can be beneficial and useful to us. Something I liked was the use of statistics, they were very useful in understanding and backing up the information that was being talked about. Something that I would have done differently is maybe implement more data to the infographic.
The visual appeal of this was out of this world. I loved the way you were talking about water and added the wave elements into the infographic. It really made the information connect with the visual aspect of the infographic. The information was well structured and not overpowering. Visually, I was intrigued and it made me want to read and learn about the subject matter.

52 comments
Eugenio Gonzalez
This infographic was both informative and visually appealing. The statistics on the percentage of impaired creeks were particularly striking. The design, especially the use of statistics, effectively highlighted the current state of this issue within our city. I appreciated how it also provided resources for those interested in making a difference.
LEE
I like this infographic. This infographic shows great results of san antonio Texas water pollution. The water is impaired easily with little bit of harmful material. I like this infographic because of it’s background color and the font of letter they showed. Thank you for the important issue and explained it well to us. Keep going on you guys work. I will support
Mikayla Trejo
This info graphic was extremely eye-catching while also being informative. Thank you for explaining an issue and a extensive manner while also being straightforward. I appreciate how you mentioned this issue and also provided solutions or Waze for the general population to help resolve or reverse this water crisis.
Alexis Silva
I love this infographic! The colors are pleasing and match the theme. The different size fonts help stress important information. I like the incorporation of the QR code as it symbolizes a point in technology we are in while providing information on how to be a river warrior. Overall, this infographic helps individuals realize a change is needed to protect our water sources.
Fernando Garza
This infographic was very good. Particularly with its message and delivery. The intro explains in a very quick but detailed manner as to what its focus is on. Afterwards it further explains how this issue is something that affects us. The use of the design and especially the statistics was very-well done as it put on display front and center where we as a city are at in terms of this issue. I also liked how it provided where someone could go if they were wanting to make a change.
Linda Aguilar
This infographic was informative and visually pleasing. The hand drawn flowers at the end of the infographic were beautiful and the color scheme of pastel blue and pink were an excellent choice. The information and percentage of the impaired creeks was shocking. The QR code to become a river warrior was an excellent idea and easy for the user to get more information. Great job!
Maria Guerrero
Wow! This has been my favorite infographic by far! I believe it’s crucial to remember that, on occasion, we truly need something to attract our attention in order to pay attention, and this infographic is so appealing and lovely to look at. The fact that people take our water for granted and that it does not meet high standards surprises me given how commonplace it is is. Amazing work!
Andrew Ramon
I really like the aesthetic of this graphic! I had no idea our water was impacted that much here in town, that is really interesting and a little gross. It’s sad for the wildlife that live in it. I do like how you provided a way to help and even included the QR code to scan that would bring up the page on how to be a river warrior. That is a really effective and simple way of increasing engagement. Excellent idea.
Eduardo Saucedo Moreno
Really good job with this infographic. This topic relates to Civic Engagement because we as a community need to ensure that our environment and, in this case, our rivers, have clean water so it can be beneficial and useful to us. Something I liked was the use of statistics, they were very useful in understanding and backing up the information that was being talked about. Something that I would have done differently is maybe implement more data to the infographic.
Lauren Sahadi
The visual appeal of this was out of this world. I loved the way you were talking about water and added the wave elements into the infographic. It really made the information connect with the visual aspect of the infographic. The information was well structured and not overpowering. Visually, I was intrigued and it made me want to read and learn about the subject matter.