Acknowledgments:
I would like to thank Dr. Sue P. Nash and Dr. Lori Boies for their help in the early stages of this project, particularly in helping me with the approach to take in my research. I am also indebted to Dr. Linda Parsi for enlightening me about the prevalence of asthma during my shadowing experience at Parsi Pediatrics. And I am most grateful to my classmates, friends, and family for their assistance in the editing phase of this project as well as for providing encouragement during my research process. Lastly, I’d like to thank Dr. Boies for allowing me to bring awareness of this issue to my community.
Tags from the story
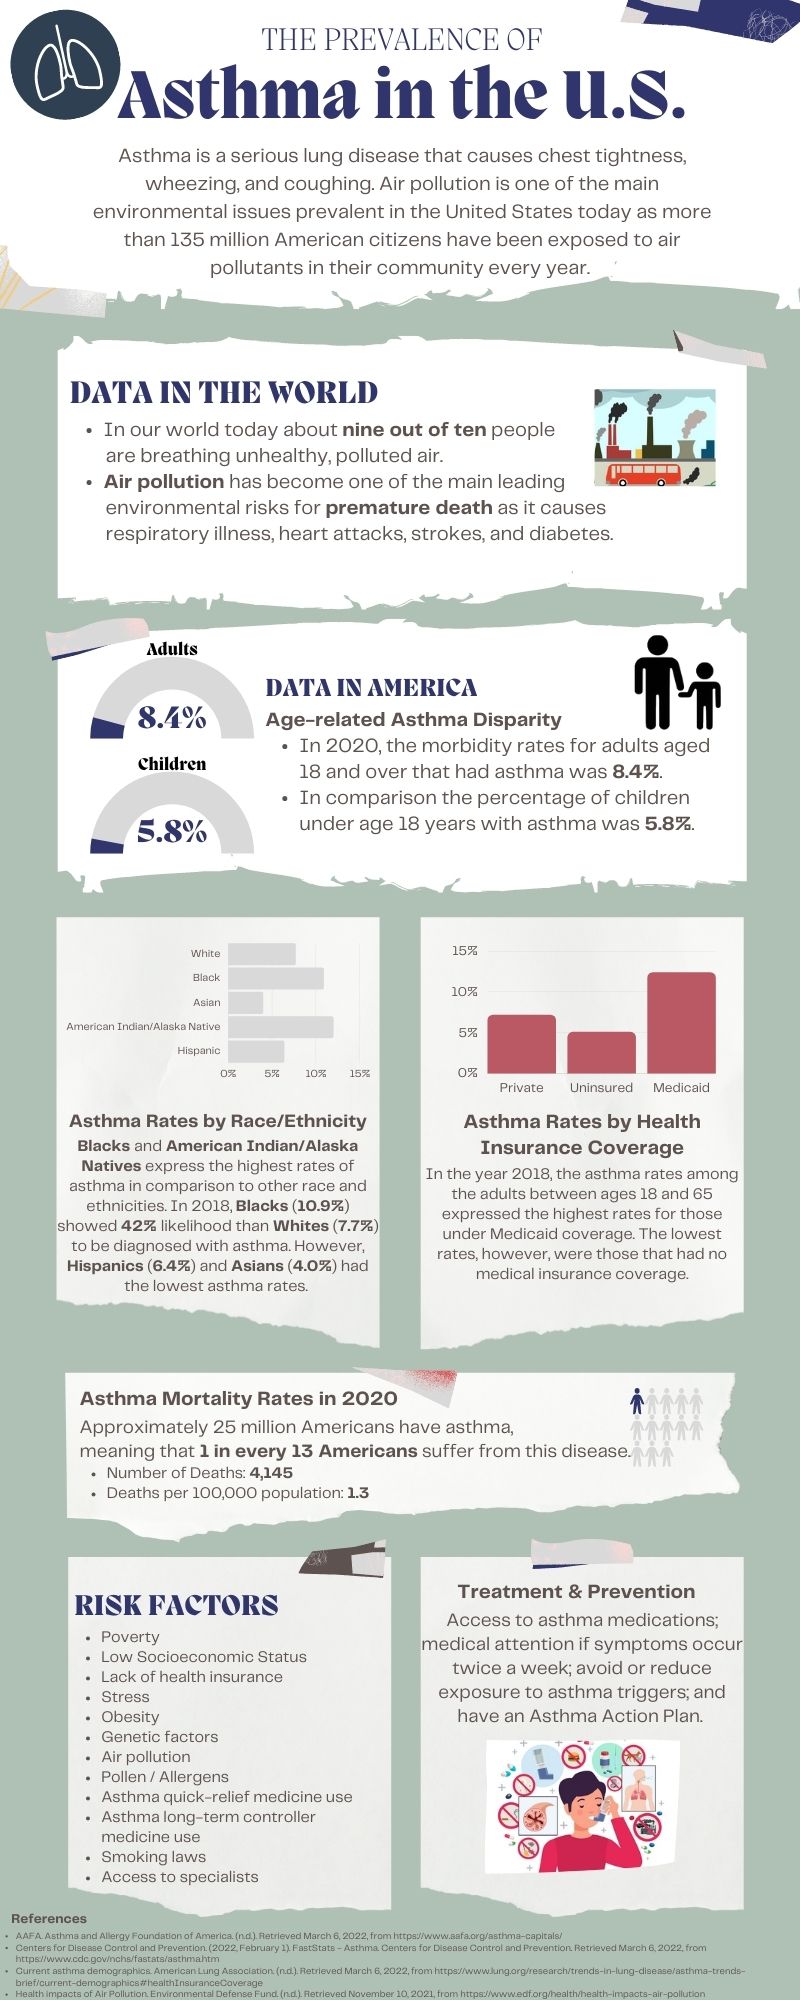
asthma

Diana Donnel
I am a Pre-Medical student with a Biology major, Chemistry minor, and certification in Public Health at St. Mary’s University in San Antonio. I was born in El Paso, Texas, and raised in San Antonio, Texas. After receiving my bachelor’s degree in the Spring of 2022, I plan on completing a dual master’s program in business administration and Public Health Administration. My passion is medicine and I plan on attending medical school to pursue a Doctor’s degree in Medicine in pediatrics with a specialization in gastroenterology. Throughout my time at St. Mary’s, I have participated in research as a student assistant in the biochemistry department and have contributed to various organizations holding officer positions, such as Risk Management and Treasurer for “Girl Up StMU” as well as Honor’s Council Chair and Education Director for Sigma Sigma Sigma National Sorority. Outside of school, I am a medical assistant and medical scribe at a pediatric clinic, Parsi Pediatrics, and have volunteered throughout my four years within my community with various Non-Profit Organizations.
Author Portfolio PageRecent Comments
Melanie Fraire
The infographic presented a lot of valuable information. I found the data presented to be very interesting and I think it’d be more interesting to see which states have a higher population of people with asthma due to air pollution considering that different cities have different levels of pollution.
12/03/2023
4:48 pm
Victoria Dubois
I love the format of this infographic that was made. It provides a comprehensive overview of the prevalence of asthma in the United States and the number of people affected by the condition which is very important information. It provides us with tips for managing asthma, including medication options and lifestyle changes which is very helpful.
12/03/2023
4:48 pm
Gaitan Martinez
Asthma is an issue that deserves more attention because it affects many individuals, not only is it inconvenient, it’s also life-threatening. Just like allergies, treatments for this disease aren’t cheap, and if asthma cases were reduced or even wiped off of history, then our society could benefit from it by reducing costs and helping lives. Air pollution is known to severely trigger asthma, but air pollution is bad in general.
12/03/2023
4:48 pm
Maximillian Morise
Hello Ms. Donnel, this was a very well made infographic on the subject of asthma with extremely nice usage of fonts, bold, colors, and formatting. Your infographic was extremely informative on the rates of asthma as well as its symptoms and deaths attributed to it. I do however think that the infographic could have used more colors and potentially more pictures to draw the attention of the audience more, but nonetheless I still think it is among one of the most competently made infographics I have seen thus far. Great job on this piece of work!
12/03/2023
4:48 pm
Fernando Milian Leyva
What a great topic for an infographic. The data is nicely presented with fresh and modern fronts that facilitate quickly grasping the important points. All the colors used are in consonance with each other, which transmits a sense of calm and helps to avoid visual noise. A simple thing like using “bold” in strategic terms makes a big difference in this illustration. The bolding of text works quite well in this case, helping the reader to identify capital terms quickly. The use of this simple yet important element demonstrates the thoughtful decisions (in terms of design) taken by the author of this exemplary infographic.
12/03/2023
4:48 pm
Mia Garza
This was an extremely useful infographic on asthma in America. I liked how the graphs used to represent the statistics helped me understand the information better than just reading it. I also liked how there was information on asthma in both America and around the world. It is important to raise awareness about asthma treatment and triggers, and this infographic does a great job at doing it.
12/03/2023
4:48 pm
Sebastian Hernandez-Soihit
This infographic is really well laid out! I enjoyed that it specifically presents asthma as something related to the issues of air pollution and creates an underlying sense of narrative: Americans are being affected by air pollution for a reason. The statistics are well laid out and are accompanies by very friendly imagery that is fitting. I see no major issues with this infographic or what it seeks to achieve, great work!
12/03/2023
4:48 pm
Aaron Astudillo
Hi Diana, I first want to thank you for creating an infographic on a topic that is not discussed that often. The colors and format of the infographic allow for the information that is being presented to be emphasized. Furthermore, the inclusion of risk factors such as socioeconomic status is very important due to society not often highlighting complications that contribute to asthma.
13/03/2023
4:48 pm
Karicia Gallegos
I thought this infographic was very informative especially because a lot of people close to me suffer from asthma. I’m really glad that the author included the risk factors of asthma because not a lot of people know them. For one, I did not know that stress is a risk factor of asthma, I never would have thought of that. I also really like that the author included the treatment and prevention because that is life -saving information. Overall, great job!
15/03/2023
4:48 pm
Greitin Rodriguez
Each time our world and the people in it are getting affected and hurt more and more. People are getting sick and getting asthma due to the air being polluted. Some get affected and hurt more than others. It has been more common to have asthma in the United States. It has killed and hurt many alive. There is not much that could be done just have a plan on how to not trigger it that much and just drink medicine. There are multiple factors that are the cause of asthma in people. It is the job of ourselves and the government to keep our planet healthy, take care of challenges that one faces, and in general just keep everyone in good health and allow them the chance to have access to the needs they need.
12/03/2023
4:48 pm