Thank you for informing individuals about the importance of donating. A lot of ways to do today comes from clothes, in order to reverse the effects of global warming, we must find more sustainable ways to live/ consume. Thank you for placing emphasis on one of the main ways and a persuasive, an informational manner.
Hi, I appreciated how the colors blended together nicely, and the fonts chosen helped the information flow together. I was not aware of how second hand clothing store prices have increased that much. It may be due to the increase in popularity of thrifting. I appreciate how the publishers listed organizations to donate to that will ensure your clothes go to someone in need.
A very great highlight of an issue that not many think about. While overall we’d strive to provide for everybody in need at no cost, this infographic tells us that our intention isn’t what IS happening. I appreciate the explanation of how this happens, even in the case of thrift stores and donation sites. Also, having information for the drive will help many to better connect to a better alternative than what we may have been assuming was the best option.
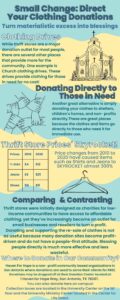
“Turn your material excess to blessings” is a power sentence to begin your infographic. Your drawing of the church and the display of hands holding each other demonstrated how we need to help each other. You color scheme of soft pastel colors was an excellent choice. The information flowed nicely especially the graphic that demonstrated how process of increased throughout the years. Thank you for sharing locations for donating clothing.
Huge congratulations on this nomination! By the figures that were included here, I was truly astounded. The one thing that stood out to me the most is that, while a thrifted shirt costing $12 might not seem pricey to someone like me who lives in the lower income bracket, it would be a significant expense for many others. Great work!
I like that your graphic provides data on how much the thrift scene has changed over the years. It’s sad how the industry has lost its original purpose of providing cheaper clothes to families that cannot afford newer ones, and instead has catered to resellers that are trying to make a quick buck. The graph you provided displays that. There’s even a call to action in your infographic by telling us how to donate, I really appreciate that part.
Nice job with this infographic. This topic relates to Civic Engagement because there are people out there that do need clothes and we as a community need to take action by helping our brothers and sisters that are in need so we can make our community happier. Something I liked were the images, they are very self-explanatory and easy to understand. Something that I would have done differently would be implementing less text, it felt very clustered towards the end.
The subject matter was very important is something that I think needs to be heard. I loved the price comparison from different years that was added. I also liked how you added a section with information where to donate clothes in your community. It gave the readers a way to engage if they wanted to instead of just reading the infographic.
Perfection! I don’t know how you did it but the material coexist very well with the direction of the poster. I never felt like the information on donating clothing and waste ever overpowered the icons or vice versa! Great job this infographic provides a great example that I will try to use as a base to create one of my own!
I loved the topic in this infographic, it’s very interesting as I never really looked into the whole donation business and how much it’s changed over the last decade. I do know that many people actually prefer to go to thrift shops in order to find clothing that is back in style. I also know that it isn’t as cheap as it used to be, which leads to your point that many people are using something that is meant to help those in need as a form of profit which doesn’t sit right. Overall I loved the layout and visuals along with the key pieces of information.


49 comments
Mikayla Trejo
Thank you for informing individuals about the importance of donating. A lot of ways to do today comes from clothes, in order to reverse the effects of global warming, we must find more sustainable ways to live/ consume. Thank you for placing emphasis on one of the main ways and a persuasive, an informational manner.
Alexis Silva
Hi, I appreciated how the colors blended together nicely, and the fonts chosen helped the information flow together. I was not aware of how second hand clothing store prices have increased that much. It may be due to the increase in popularity of thrifting. I appreciate how the publishers listed organizations to donate to that will ensure your clothes go to someone in need.
Fernando Garza
A very great highlight of an issue that not many think about. While overall we’d strive to provide for everybody in need at no cost, this infographic tells us that our intention isn’t what IS happening. I appreciate the explanation of how this happens, even in the case of thrift stores and donation sites. Also, having information for the drive will help many to better connect to a better alternative than what we may have been assuming was the best option.
Linda Aguilar
“Turn your material excess to blessings” is a power sentence to begin your infographic. Your drawing of the church and the display of hands holding each other demonstrated how we need to help each other. You color scheme of soft pastel colors was an excellent choice. The information flowed nicely especially the graphic that demonstrated how process of increased throughout the years. Thank you for sharing locations for donating clothing.
Maria Guerrero
Huge congratulations on this nomination! By the figures that were included here, I was truly astounded. The one thing that stood out to me the most is that, while a thrifted shirt costing $12 might not seem pricey to someone like me who lives in the lower income bracket, it would be a significant expense for many others. Great work!
Andrew Ramon
I like that your graphic provides data on how much the thrift scene has changed over the years. It’s sad how the industry has lost its original purpose of providing cheaper clothes to families that cannot afford newer ones, and instead has catered to resellers that are trying to make a quick buck. The graph you provided displays that. There’s even a call to action in your infographic by telling us how to donate, I really appreciate that part.
Eduardo Saucedo Moreno
Hello!
Nice job with this infographic. This topic relates to Civic Engagement because there are people out there that do need clothes and we as a community need to take action by helping our brothers and sisters that are in need so we can make our community happier. Something I liked were the images, they are very self-explanatory and easy to understand. Something that I would have done differently would be implementing less text, it felt very clustered towards the end.
Lauren Sahadi
The subject matter was very important is something that I think needs to be heard. I loved the price comparison from different years that was added. I also liked how you added a section with information where to donate clothes in your community. It gave the readers a way to engage if they wanted to instead of just reading the infographic.
Daniel Gutierrez
Perfection! I don’t know how you did it but the material coexist very well with the direction of the poster. I never felt like the information on donating clothing and waste ever overpowered the icons or vice versa! Great job this infographic provides a great example that I will try to use as a base to create one of my own!
Luis Dena
I loved the topic in this infographic, it’s very interesting as I never really looked into the whole donation business and how much it’s changed over the last decade. I do know that many people actually prefer to go to thrift shops in order to find clothing that is back in style. I also know that it isn’t as cheap as it used to be, which leads to your point that many people are using something that is meant to help those in need as a form of profit which doesn’t sit right. Overall I loved the layout and visuals along with the key pieces of information.