April 6, 2022
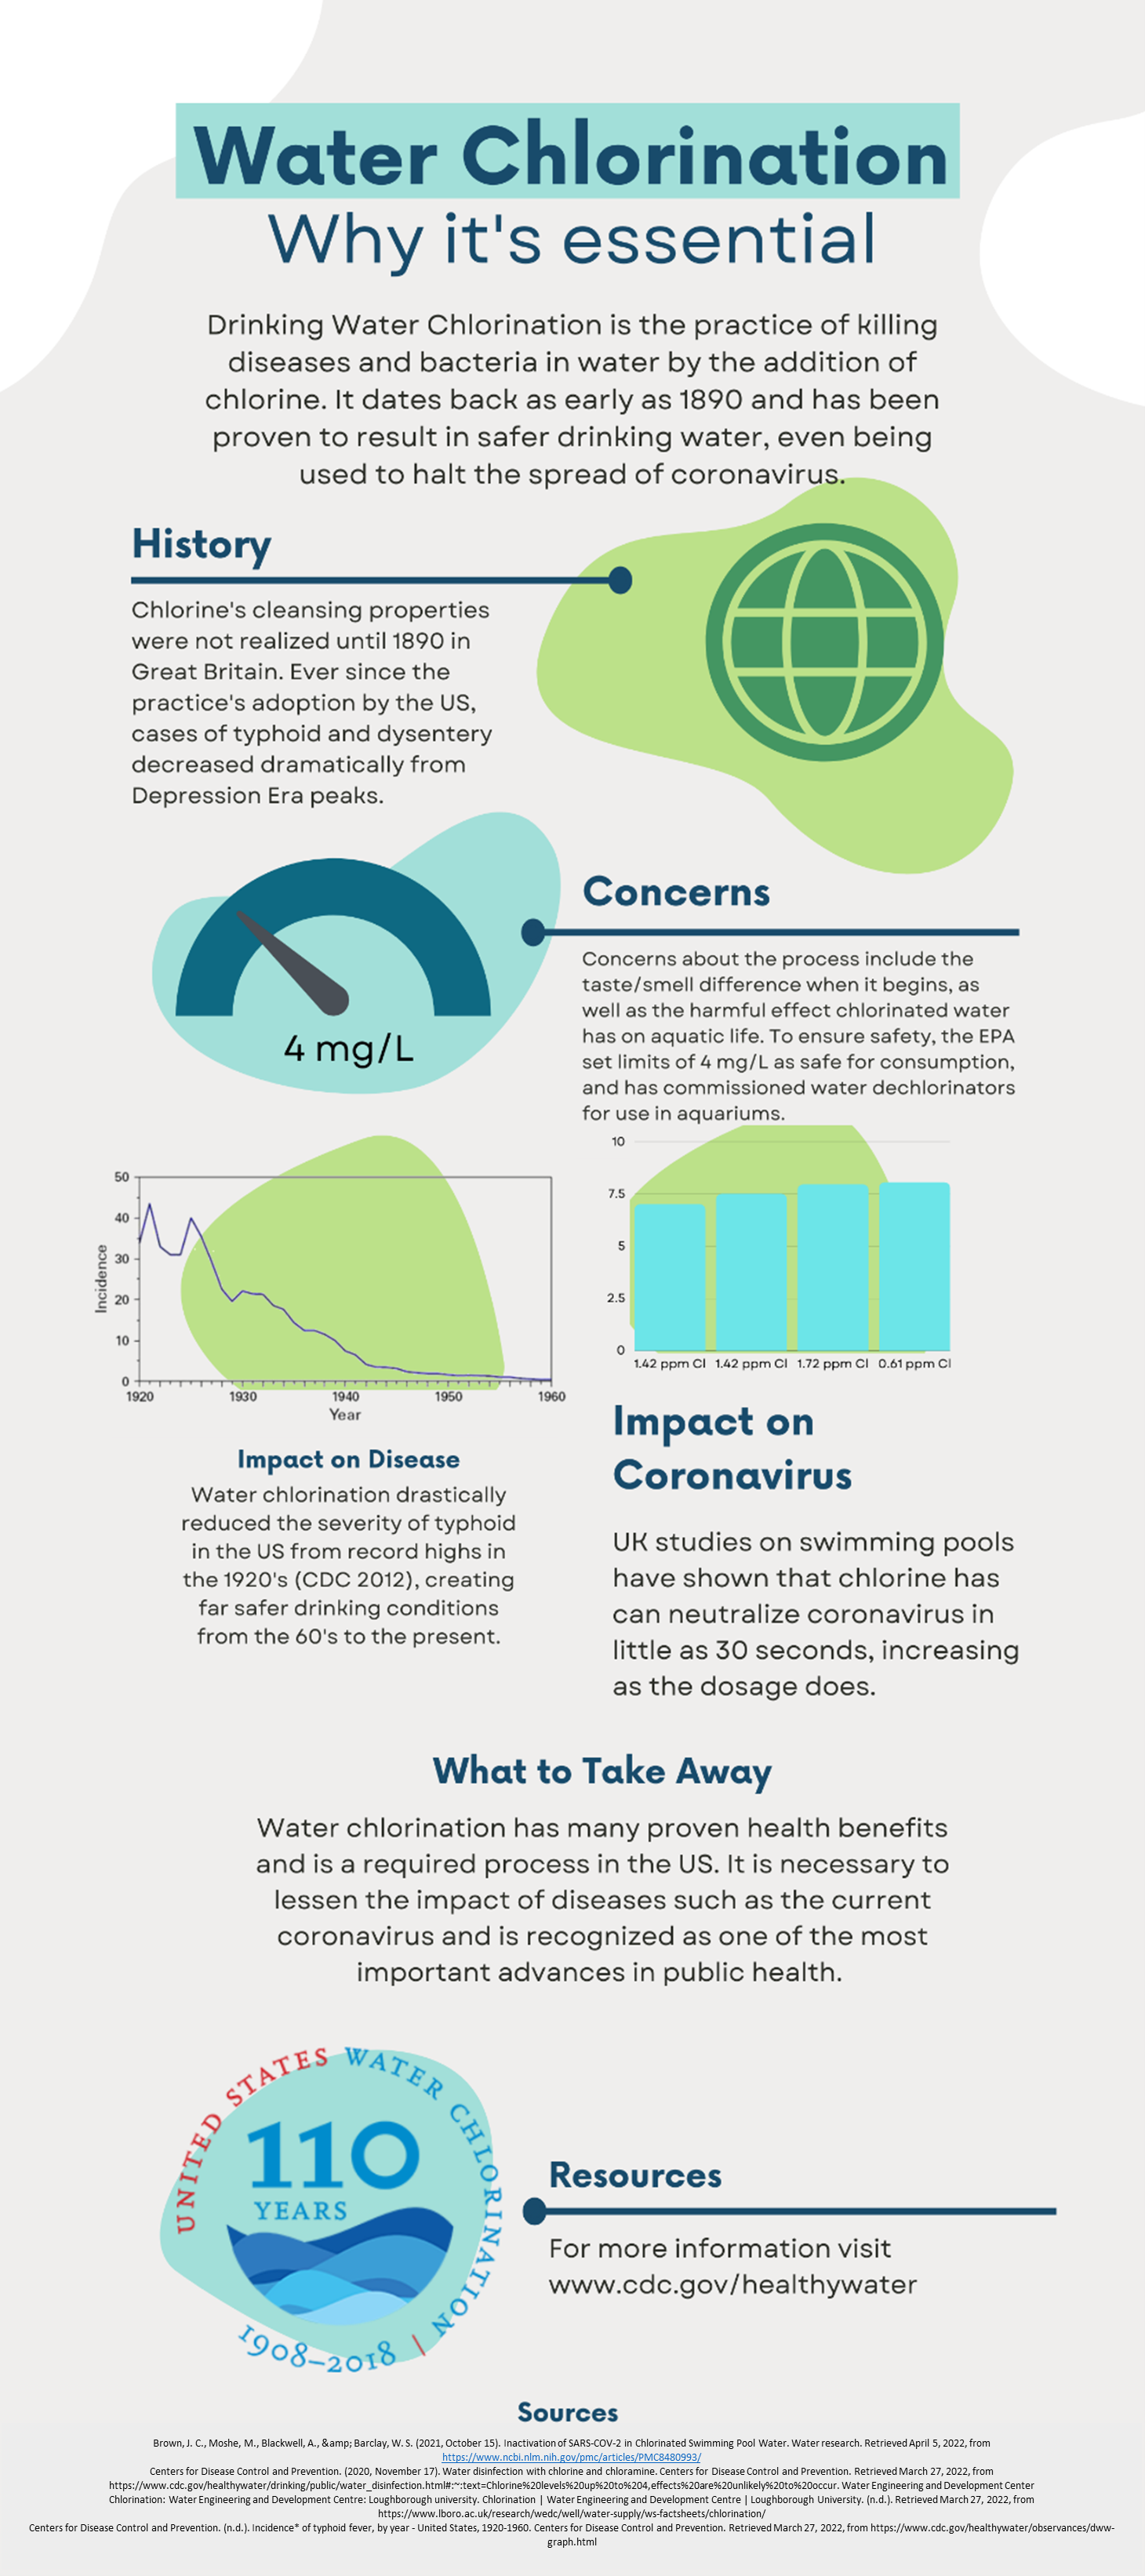
Water Chlorination – Why It’s Essential
Tags from the story
chlorination
public health
Water

Byron Cox
My name is Byron Cox and I am an environmental science major from the city of Helotes, Texas. I’m currently a junior with a set graduation date of May 2023 and a desire to aid in city-wide conservation efforts. I often spend my time being with friends or doing volunteer work, though the best times are when I’m doing both! My goal is to do the most I can for the conservation field, and I look forward to a career someday doing just that.
Author Portfolio PageRecent Comments
Matthew Holland
This infographic was very brief but still incredibly insightful, giving us all the information, we need in as short a time as possible. A skill that is not easy to do with some information but worked really well here. I especially liked that there was a “take away section” that way if the information above is too much for some people they can still get the gist of what the infographic is about.
05/03/2023
2:15 pm
Jonathan Flores
I really liked your infographic! I like how you used a neutral and monotone color scheme because not only was the graphic visually appealing, but your information also came to life against the graphic. In addition, I think the formatting you used was really great and laying out the information in a simple and digestible manner. My only small piece of constructive criticism would be to make the subheadings where the two graphs are, side by side, to be the same size and level the text to be cohesive. Nonetheless, great job!
05/03/2023
2:15 pm
Maximillian Morise
Firstly, Mr. Cox, this is a very clean and well made infographic that is easy to read and understand data within. I enjoyed how informative it was as well as its use of simple pictures that made the information it was giving easy to digest and comprehend. I also did not know that Chlorinated water had such an affect on reducing risks regarding the Coronavirus, so I am very pleased that this infographic was not just very well made but also quite informative. I enjoyed your work and I appreciate it greatly!
05/03/2023
2:15 pm
Esmeralda Gomez
I really love the colors that you chose to use for this infographic. The information really pops out, and the colors guide the eyes to follow the flow of information. The contrasts and complimentary colors that were used for the infographic are really pleasing to the eye, especially since the color shades are not too harsh or too light! Amazing job.
05/03/2023
2:15 pm
Alexander Garcia
I enjoyed reading this infographic because it was super informative and it taught me a lot. Not only was this article good because it was full of useful information, but it was also good because it discusses a topic that is highly relevant to today. I applaud the author Byron Cox for this very useful infographic that taught me another way to fight Covid-19.
05/03/2023
2:15 pm
Victoria Dubois
The amount of colors that you used on this infographic was very well balanced. It was enough for the information that was being presented but not too much to confused the reader. It a very well written infographic and gave us important factors about the topic. This infographic gave me the reader a lot of information that I didn’t know about water chlorination and how it can help with bacteria and diseases.
05/03/2023
2:15 pm
Carlos Alonzo
Interesting Info-graphic! I especially like the layout of the title and colors used. I am curious if there are other efficient methods to make safer drinking water, given that chlorination kills diseases and bacteria or is this the most effective method? I like the link to the CDC and the image with “110 years” to show how long the process has been implemented in the U.S., good job!
05/03/2023
2:15 pm
Joseph Frausto
Very interesting graphic! The arrangement of information from top to bottom really helped lead us through the different aspects of chlorination while the inclusion of the graphs and charts illustrated your information in a more effective way.
05/03/2023
2:15 pm
Mia Garza
This is a very nice and simple infographic that gets straight to the point. I had never heard of water chlorination before, and this infographic was able to successfully inform me of the basics of the practice. The format that was used was simple to read with a good balance of words and images to keep you interested in the information.
05/03/2023
2:15 pm
Sierra Christa
I loved the infographic you created. It included valuable information that I had not known about. I think your infographic was simple in a great way! There was a perfect balance of words and pictures that made me actually want to read it while also supporting your in for graphic with historical evidence from the past.
04/03/2023
2:15 pm