
Acknowledgments:
I would like to express my sincere gratitude to Dr. Lori Boies for her valuable guidance and support during the development of this project. Her insights into the importance of nutrition have been instrumental in shaping the direction of this infographic. I am also grateful to my friends and family for their continuous encouragement and feedback, which greatly helped in refining the final presentation. Thank you to everyone who has supported me throughout this journey, especially to Dr. Boies for allowing me to bring awareness of this issue to the community.

17 comments
Carollann Serafin
I think this Infographic is so adorable and really insightful this is really helpful as someone who recently started taking care of my nutrition and calorie count I enjoy seeing it be talked about as I did not realize before how unhealthy I actually had been eating on a day to day bases. We learn so much from a young age with this and to older what we need to properly fuel our body. This has been one of my favorite infographics and it is not overwhelming to understand
Nicholas Quintero
I appreciate how well the information in this infographic is organized and structured, it’s done extremely well. The infographic itself contains a lot of information about nutrition throughout one’s life, but by breaking that information up further into specific ages groups, the information becomes much more digestible and easier to follow. I think the way it flows, from top with infancy to the bottom with 65+ year olds is a nice touch, as the readers eyes would naturally look left to right and top to bottom when reading a text. The color coding of each age group and informative piece was another nice touch both for differentiation and to make it look prettier.
Karicia Gallegos
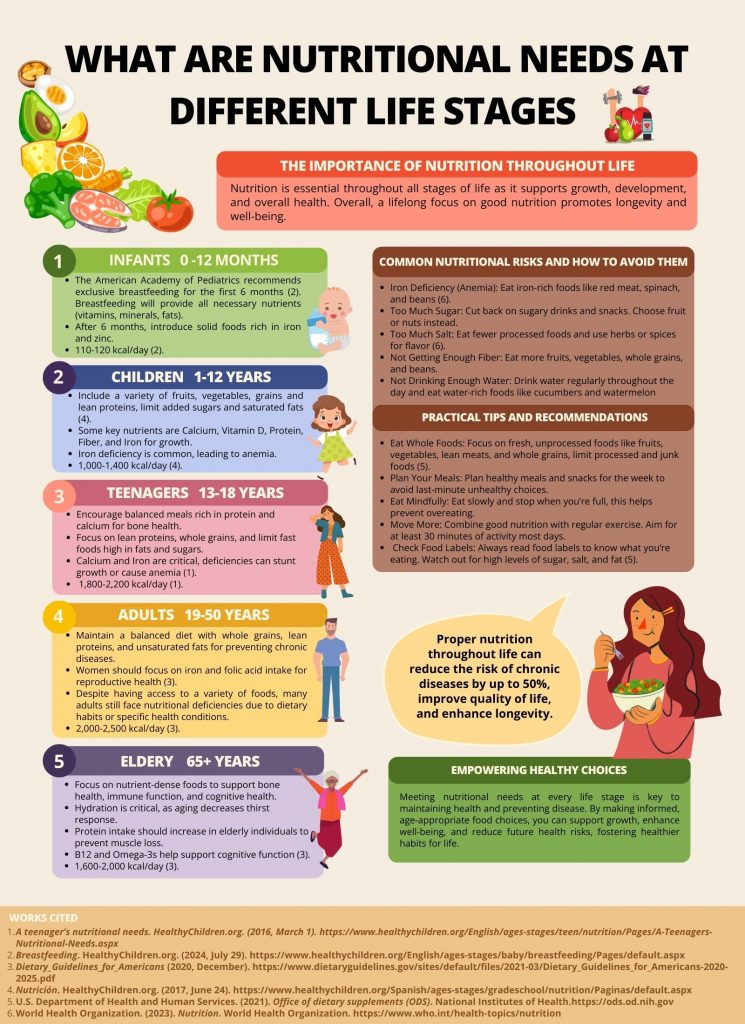
I really like your infographic! It provides a clear and informative breakdown of how nutritional needs change across different life stages, emphasizing the role of diet in overall health and development. It effectively highlights key nutrients like iron, calcium, and protein, which are essential for growth in children and teenagers, as well as for maintaining muscle mass and cognitive function in older adults. I found the section on hydration for the elderly particularly interesting, as aging reduces thirst response, which is something often overlooked. Additionally, the focus on folic acid for women’s reproductive health is an important inclusion. Overall, this infographic serves as a useful guide for understanding how proper nutrition supports long-term well-being. Wonderful job!
Andrew Ramon
Beautiful work Monteserrat! The way you have each age group separated into little boxes with different colors makes the infographic flow well without much repetition. Everything is organized neatly in easy to understand font and categories. Bullet points are much better to look at than paragraphs! You even have little photos representing the age groups next to them, nice touch. This looks like professional work, something I would see at a doctor’s office!
tmcsherry
I found your infographic very informative. I think your use of color and the distinct sections result in a clear and concise exploration of nutrition concerning life stages. You have created a visually appealing and educational infographic that I found interesting and easy to understand.
jngethe
This infographic is very aesthetically appealing to look at and makes one more interested in the information presented. The use of bright colors can be tricky but with the combination of organization and the use of different shades of colors this infographic is very well put together and easy to follow.With the help of a few visual depictions I can also further understand the age groups being referred to and how each one differs from the previous one. There is a lot of information to be taken in so a few bolder words can help the read to sort the most important information or word in a sentence is as well as a little space between points.
Jesse Turnquist
This infographic was very well done. I enjoyed how you structured it, which was very eye-catching to the individual reading it. I also enjoyed the information you provided on nutrition, as it can help many adjust their diets to live a healthier lifestyle. I also liked how you added the common nutritional risks that many are facing/dealing with today.
kparedes1
This was an interesting infographic and the topic itself was a great one. As I read through it I found it fascinating what intake certain age groups needed. I feel as if this isn’t talked about often and this infographic is a great way of informing people. The infographic itself is well structured, I love the color choices, and I love how each section is color coded with extra factual information.
Freya Hayes
I really like this infographic. I think this is a topic that more people need to be educated on. One thing I learned from this article is that iron deficiency is common for kids age 1-12 years old. I really enjoyed the visuals used throughout this infographic and I think the color scheme makes it more appealing to a larger audience. I also really like that the author provided tips, not only does the infographic educate people it is also a resourceful tool for people to change and improve their diet. Overall I really enjoyed this infographic and think it is a very resourceful tool. My question would be why more people aren’t educated in this topic.
Zoe Klupenger
Hi!
I love the quality of this infographic. It is clear there was a lot of research put into this, and the end result is very eye-catching. I learned a lot from this infographic, I never knew how specific food diets are based on your age group. You were able to provide a lot of information without it being too much for one to stay interested in, I liked that. Great job!