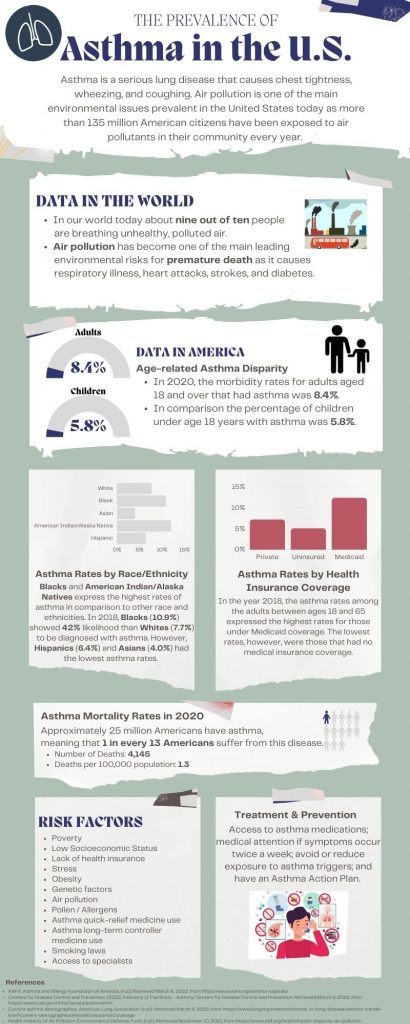
Acknowledgments:
I would like to thank Dr. Sue P. Nash and Dr. Lori Boies for their help in the early stages of this project, particularly in helping me with the approach to take in my research. I am also indebted to Dr. Linda Parsi for enlightening me about the prevalence of asthma during my shadowing experience at Parsi Pediatrics. And I am most grateful to my classmates, friends, and family for their assistance in the editing phase of this project as well as for providing encouragement during my research process. Lastly, I’d like to thank Dr. Boies for allowing me to bring awareness of this issue to my community.


51 comments
Emilee Luera
Asthma is one of the first ailments covered in children’s television shows. I even learned a few things that I had no knowledge of, which is odd given how many people I know who have asthma. The fact that your infographics statistics were highlighted really brought the numbers to life and made it easier to follow. Great research on asthma and excellent reading!!
Bijou Davant
I never knew the huge impact of air pollution! I knew it was bad but not this dangerous. It really is scary to think about and it makes you realize there needs to be action taken as soon as possible. The infographic is lay out really nicely and is incredibly informitive!
Olivia Flores
I love this infographic! It definitely brings the awareness because asthma can be a very scary thing for many people, and it is sad that some people can’t afford the proper treatment they need. It is importance to bring awareness to this topic and possible solutions for lower income families. Great job with the layout and color scheme as well I loved it.
Rosa Inocencio
Very well organized and very informative infographic! I really like that this infographic talks on asthma especially since not everyone knows about asthma or has any form or good knowledge on it. It was also very shocking to know that due to pollution in the air that it is one of the main leading environmental risks for premature death, I would have never thought of that, Great Infographic!
Andrew Ponce
Hello Diana! The initial visuals of this graphic are outstanding. Visual it is very appealing, which is ideal for infographics such as this one. The information in this graphic is also very interesting and relevant. Many people suffer from this issue for it not to be mentioned much in a collegiate setting. The graph itself is very easy to follow and very coherent. Excellent job on the infographic!
Juan Aguirre Ramirez
Great job, Diana! Your infographic is an eye-opener and presents the severity of the issue of asthma and air pollution in the US. The data and statistics presented are truly alarming, and it’s commendable how you have included solutions to combat this issue. Also I appreciated the visual representation of the information which makes it easy to understand. It’s unfortunate that low-income people are more susceptible to asthma and its effects, and it highlights the need for equal access to healthcare. Again, well done on creating such an informative and visually appealing infographic!
Yaniev Ibarra
Good infographic Diana! The prevalence of asthma in the United States is greater than I thought but I was aware that air pollution is a contributing factor to the increase in people affected. Your infographics statistics being highlighted really brought a greater focus to the numbers and made it easier to follow. Great research on asthma overall.
Analyssa Garcia
This infographic has such useful information. I even learned a few things that I had no idea about, which is kind of strange because the amount of people I know who have asthma is crazy. I think the colors and everything looks very nice, good work.
Daniela Garza Martinez
Asthma is one of the first illnesses that are usually seen addressed in children’s TV shows. However in schools we’ve never learned in depth analysis of the illness despite its common occurrence in the population. I think the graphics on this info graphic are very well thought out and relevant to the research. I also appreciate the rates by the nursery and buy health insurance coverage graphs being so easy to understand.
Xavier Bohorquez
I really like that this infographic helps recognize the severe threat asthma has in the U.S. I can’t even imagine what the world statistics look like but this makes for a perfect heads-up to people who read this. I would like to congratulate Diana for bringing this up with prominent data and solutions to help prevent the cause so much. I appreciate the effort in the format and structure to make this more appealing for the reader to see how grim the situation really is.