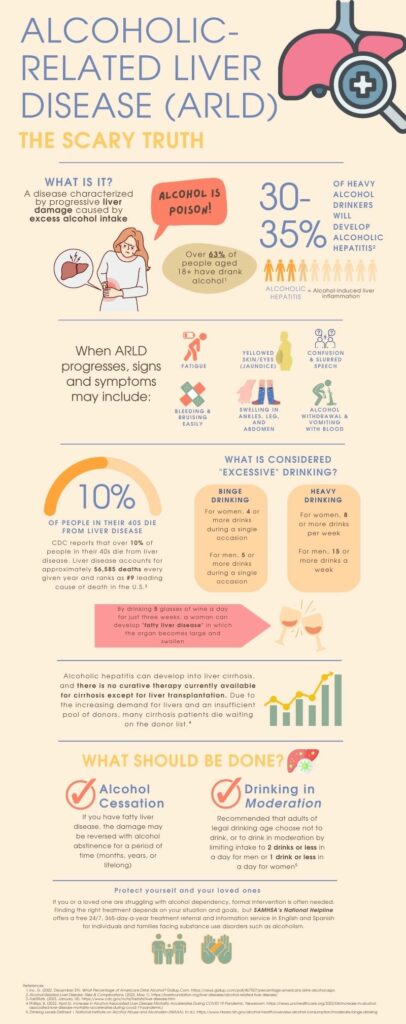
Underage drinking and alcohol abuse is the most prevalent among college students, so awareness of the long-term detrimental effects of alcoholism is necessary. This project was supported by Dr. Boies for allowing her Epidemiology students like myself to discuss health-related issues that we feel most called to bring awareness to.
April 3, 2023
Alcohol-Related Liver Disease (ARLD) Infographic

Tags from the story


47 comments
Angelina Reyes
This infographic on Alcoholic-related Disease (ARLD) caught my attention because it clearly explains how the misuse or overuse of alcohol can impact an individual so heavily. A detail i enjoyed was the placement of visuals next to the symptoms, which might help readers fully grasp how you can be affected and what to watch out for in a person with the particular disease. Overall, this was a well-designed and informative infographic that effectively communicates what ARLD consists of as far as symptoms, how to obtain, and how to prevent.
agarcia428
Hello Amanda! After reading this infographic, I learned how easy it is for someone to develop diseases or side effects from over alcohol consumption due to the amount of carbohydrates it contains (such as beer and cocktails). Drinking is a very common thing to do for many occasions in many parts of the world, so it’s important to learn how to drink responsibly and educate loved ones.
Gabriella S
This is infographic hits on important stats and topics of ARLD. It is uniformed and concise. It addresses ways for potential reversal and prevention. The stats on binge drinking and heaving drinking was interesting to me. The binge drinking difference between men and women is much smaller than the difference in drinks to be considered heavy drinking. Overall very informational!
fdeguzman
I really liked this infographic on Alcohol-Related Liver Disease (ARLD) because it clearly explains the biological impact of excessive alcohol consumption and its serious long-term consequences. I appreciate how the statistics on prevalence of alcoholic hepatitis and liver-related deaths were included to show the severity of this problem. As someone interested in health and life sciences, this helped me better grasp how lifestyle choices directly affect organ function. Overall, this was an informative and impactful infographic.
Nicole Vanegas
I love the awareness that you’re bringing with this infographic. Alcohol use and abuse seems like it’s becoming increasingly prevalent, yet it’s rarely taken seriously. Especially in a college community it’s really normalized. I really like the way that you presented the information in a concise but informative manner, it really makes the infographic easy to follow along with. Lastly, the intervention resource was a really nice touch and will probably help more people than you know. Awesome job!
Jacqueline Flores
This infographic was intense but eye-opening. I didn’t realize how dangerous alcohol could be, especially how quickly it can damage your life. The part about binge drinking and how it affects women is something people don’t talk about enough. Including a short story or quote from someone affected by ARLD I believe would’ve helped to make it even more powerful.
lramirez49
What a creatively designed infographic, highlighting all the key aspects of this disease. I like how you included the varying amounts of moderation in drinking between both sexes as this is a key difference not many people know about. The figures and pictures really grab the audience’s attention which I find vital in an issue that is only growing more prevalent. Overall, fantastic infographic!
Aaron Lupian
This infographic does a great job at displaying the detriment of overconsumption of alcohol. The use of statistics gives an illustration of how consuming alcohol is a majority and the likelihood of developing health issues can be attributed differently between male and female. The small illustrations were helpful and made the reading experience more enjoyable especially for the symptoms section as it aided in what to look out for with ALRD.
Samantha Nguyen
Hey Amanda! I want to start of by saying how excited I am reading your poster. I am doing research in a similar area to your topic (Phosphatidylethanol-alcohol biomarker) and it gave me some insight onto mine, thank you! I would love to get to know more about your research, and what made you consider it. I love how insightful your poster is and the amount of statistics to back up your research. Thank you!
Laila Sosa
Hi Amanda,
When people think of alcohol, they typically associate it with fun and relaxation but, indulging in alcohol can lead to serious health implications as you have demonstrated with ARLD. This is a problem not only faced here in America but can be applicable all over the world especially when it comes to underage drinking and how it opens the door to a wide range of health issues. Overall, this infographic is extremely helpful in spreading awareness of overindulgence. I believe one minor change that could be made is increasing the font size to make it easier for readers to view since I did have a bit of trouble seeing the text other than that Great job!