The infographic was very informative about my own experiences with allergies. I really have a severe case of them and honestly, this made me see it from a better perspective. The solutions section is always better to look at and it makes me feel more educated on the issue. I’d also recommend this infographic to a colleague or family member for them to see as well.
I thought this infographic was informative and advanced my understanding of allergies. I enjoyed the addition of the demographic data inclusion and the financial costs associated with allergies. I thought these additions were interesting and eye-opening. Many people do not realize the economic impact of health concerns, especially common issues such as allergies. One change I would make would be to provide more detailed information, particularly in the area of demographics. As mentioned, the addition of the table is unique and extremely important. However, because of the importance of understanding marginalized groups are affected, I would have liked to see more info regarding this area of interest.
Hello Adrian! Thank you for sharing your infographic with us! I really enjoyed the visuals as well as the color scheme. Your infographic was a very good way to teach others things that they did not know about allergies. The part that shows that race affects deaths by allergies saddened me, as I have never read this information before. I learned a lot from your infographic, and it was very easy to digest.
Hi Adrian! Firstly, I loved the colors you selected and the format you organized the information! It really made me follow and concentrate on the information provided. Secondly, I really enjoyed that you talked about the critical topic of allergies. I do feel like allergies are a very know illness, but this information did highlight some important factors that I had no idea resulted from allergies. Overall, I was really interested and enjoyed reading your infographic! Great job Adrian!
Wow! This is a very interesting infographic, especially for someone who struggles with allergies. I enjoyed how most of the information was visual and not tiny text boxes. It covered every aspect of allergies in a clean-cut manner. It was well planned out, it presented the issues as well as solutions.
I loved the color scheme throughout this infographic. Everything was very clean and easy to read and I was able to get the information. It is shocking to see how many people suffer from allergies and how much it costs the US as a whole. I would maybe also add how much it costs the average American because that is something I would also have loved to see.
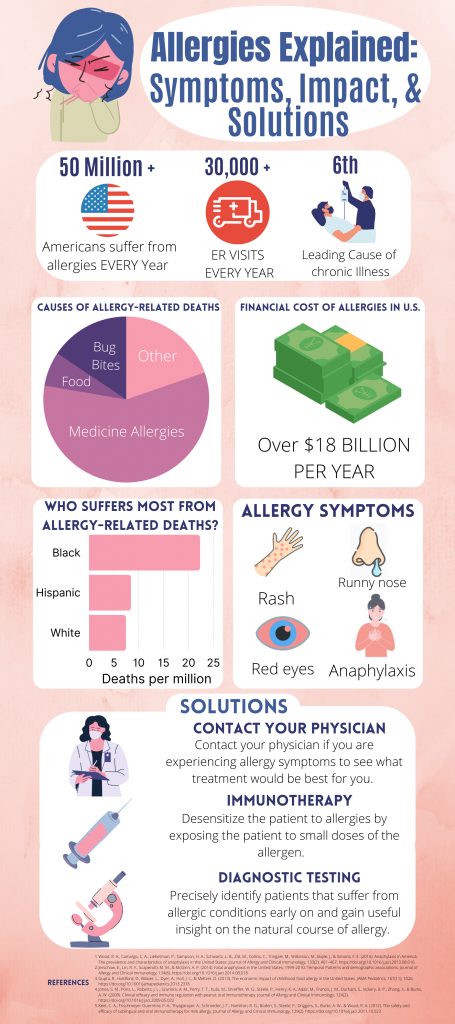
I like the colors chosen for this info-graphic! The Introduction is clear and to the point. The number of people that suffer from allergies is huge! Not to mention the number of people going to the ER and the facing chronic illness from common allergies. I like the graphics used for this info-graphic. I like the pit chart and that finical cost was incorporated into the design. Allergy-related deaths bar graphs are interesting, I am not sure what its purpose is, apart from highlighting the audience for the info-graphic. Highly informative and flushed!
Allergies are common thing among individuals all over the world. Many people suffer and end up spending a ton of money going to the ERs. I do love the imagery, the statistics on the death of individuals as well as the solutions given at the bottom of the infographic. I do enjoy all the imagery. However, I wish there were more tidbits of information that could explain the different solutions more in-depth or more information. I truly enjoyed the colors that are easy to catch the eye as well as the title being easily relatable to various individuals. Great Job Adrian
This was a very detailed and informative infographic! I did not know that allergies are the 6th leading cause of chronic illnesses in the United States. I never would of thought that allergies affect that many people, but they do. Allergies affect more than 50 million Americans every single year. One thing that I really like is how the author included the solutions for allergies, that’s very helpful. Great work!
Hello Adrian, your infographic is very effective due to its simple format, allowing for easy interpretation of the topic of allergies. Furthermore, as an individual who suffers from allergies, it is interesting to learn its impact on the general population and how much we spend on addressing it annually. Overall, the infographic was written very well.


51 comments
Xavier Bohorquez
The infographic was very informative about my own experiences with allergies. I really have a severe case of them and honestly, this made me see it from a better perspective. The solutions section is always better to look at and it makes me feel more educated on the issue. I’d also recommend this infographic to a colleague or family member for them to see as well.
Karah Renfroe
I thought this infographic was informative and advanced my understanding of allergies. I enjoyed the addition of the demographic data inclusion and the financial costs associated with allergies. I thought these additions were interesting and eye-opening. Many people do not realize the economic impact of health concerns, especially common issues such as allergies. One change I would make would be to provide more detailed information, particularly in the area of demographics. As mentioned, the addition of the table is unique and extremely important. However, because of the importance of understanding marginalized groups are affected, I would have liked to see more info regarding this area of interest.
Maya Naik
Hello Adrian! Thank you for sharing your infographic with us! I really enjoyed the visuals as well as the color scheme. Your infographic was a very good way to teach others things that they did not know about allergies. The part that shows that race affects deaths by allergies saddened me, as I have never read this information before. I learned a lot from your infographic, and it was very easy to digest.
Natalia Bustamante
Hi Adrian! Firstly, I loved the colors you selected and the format you organized the information! It really made me follow and concentrate on the information provided. Secondly, I really enjoyed that you talked about the critical topic of allergies. I do feel like allergies are a very know illness, but this information did highlight some important factors that I had no idea resulted from allergies. Overall, I was really interested and enjoyed reading your infographic! Great job Adrian!
Carina Martinez
Wow! This is a very interesting infographic, especially for someone who struggles with allergies. I enjoyed how most of the information was visual and not tiny text boxes. It covered every aspect of allergies in a clean-cut manner. It was well planned out, it presented the issues as well as solutions.
Sierra Christa
I loved the color scheme throughout this infographic. Everything was very clean and easy to read and I was able to get the information. It is shocking to see how many people suffer from allergies and how much it costs the US as a whole. I would maybe also add how much it costs the average American because that is something I would also have loved to see.
Carlos Alonzo
I like the colors chosen for this info-graphic! The Introduction is clear and to the point. The number of people that suffer from allergies is huge! Not to mention the number of people going to the ER and the facing chronic illness from common allergies. I like the graphics used for this info-graphic. I like the pit chart and that finical cost was incorporated into the design. Allergy-related deaths bar graphs are interesting, I am not sure what its purpose is, apart from highlighting the audience for the info-graphic. Highly informative and flushed!
Illeana Molina
Allergies are common thing among individuals all over the world. Many people suffer and end up spending a ton of money going to the ERs. I do love the imagery, the statistics on the death of individuals as well as the solutions given at the bottom of the infographic. I do enjoy all the imagery. However, I wish there were more tidbits of information that could explain the different solutions more in-depth or more information. I truly enjoyed the colors that are easy to catch the eye as well as the title being easily relatable to various individuals. Great Job Adrian
Karicia Gallegos
This was a very detailed and informative infographic! I did not know that allergies are the 6th leading cause of chronic illnesses in the United States. I never would of thought that allergies affect that many people, but they do. Allergies affect more than 50 million Americans every single year. One thing that I really like is how the author included the solutions for allergies, that’s very helpful. Great work!
Aaron Astudillo
Hello Adrian, your infographic is very effective due to its simple format, allowing for easy interpretation of the topic of allergies. Furthermore, as an individual who suffers from allergies, it is interesting to learn its impact on the general population and how much we spend on addressing it annually. Overall, the infographic was written very well.