I would like to thank my family and friends for their support through the writing and editing process. I would also like the thank Dr. Boies for her guidance and encouragement through the completion of the project.
- Science & Engineering
- Biology
- Scientific Ethics
- Bioinformatics
- Responsible Conduct of Research
- Public Health
April 7, 2024
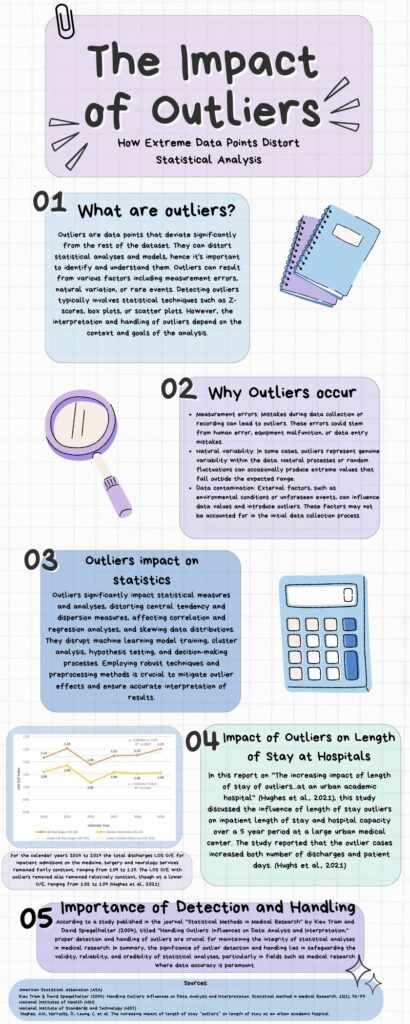
The Impact of Outliers- How Extreme Data Points Distort Statistical Analysis
Tags from the story

Rebecca Torres
Author Portfolio PageRecent Comments


¿Inglés sin barreras? Cómo Contribuye el Lenguaje de Internet a la Brecha Digital
Felicia CruzNovember 10, 2020


5 comments
Deven Garcia
Your infographic on the distortion of data by outliers was truly captivating. The flow of your presentation was impeccable, making it easy to grasp the concepts outlined. You’ve done an outstanding job of highlighting the significance of a data set often overlooked, and your ability to bring it into perspective is commendable. Congratulations on your well-deserved deserved nomination!
Naya Harb
Hi! This infographic was so interesting and new to me! I had never known how serious outliers are, before today. This is crucial to many different studies. I love how much information and detail you provided in this infographic. This topic should be talked about more because I feel like people do not think about often. Great infographic layout! Congratulations on being nominated
Vianna Villarreal
This is so interesting to think about. Im currently in a political research class and it is a little crazy to me how there is a 5% chance that some of this data will be mistaken with their methods. For political decisions I think that is insane especially with the outlier factor there is still so much room for mistakes when researching political affiliations and political interest.
Esmeralda Gomez
I loved the theme of this infographic! Thorough and detailed about the importance of outliers, this brought a lot of attention to something that I believe a lot of people brush aside, but could actually be very crucial to scientific or academic studies! I loved the color usage, the implementation of related icons really helped bring the entire composition of the infographic together! Great job and congratulations on your nomination.
Jonathan Flores
A good infographic that is jam-packed with information regarding an important topic when we study statistics and other quantitative measures. As someone who has conducted a serious of research involving cases of outliers, it is hugely important to understand what they mean and how they can effect our conclusions. I feel that this infographic would be helpful in doing so, and good job.