Acknowledgments:
I would like to thank Dr. Sue P. Nash and Dr. Lori Boies for their help in the early stages of this project, particularly in helping me with the approach to take in my research. I am also indebted to Dr. Linda Parsi for enlightening me about the prevalence of asthma during my shadowing experience at Parsi Pediatrics. And I am most grateful to my classmates, friends, and family for their assistance in the editing phase of this project as well as for providing encouragement during my research process. Lastly, I’d like to thank Dr. Boies for allowing me to bring awareness of this issue to my community.


51 comments
Karah Renfroe
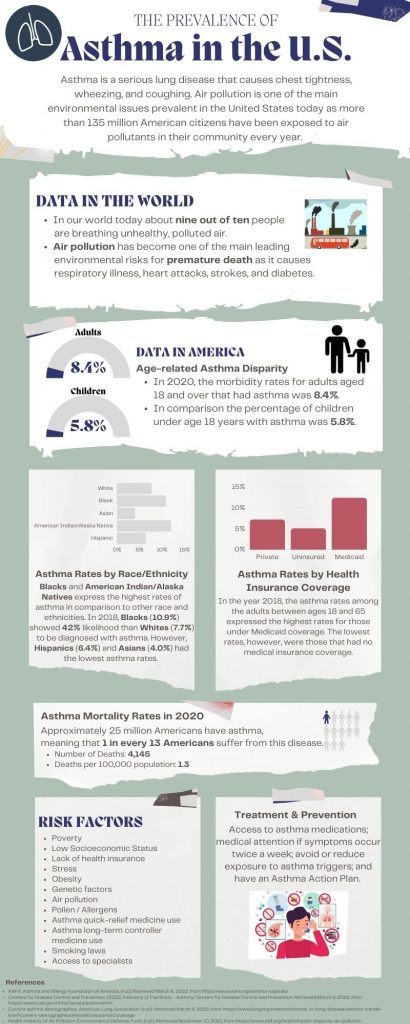
This infographic is extremely detailed and informative. As someone that is not well-informed on the issue of asthma, I was able to gain a good understanding of the topic after reviewing this infographic. I like how the infographic covers data for both the US and the world. I also like how solutions are presented and the potential causes and risk factors. The only issue I see with the infographic is the layout/design. While the infographic has a lot of great information, at times it can be confusing and overwhelming to dissect. I think this can be improved by utilizing bullet points and additional pictures/pic art.
Maya Naik
Hello Diana! I loved the colors and graphics that you chose for this infographic. It was very visually appealing. I enjoyed how you made environmental and economic connections to this health conditions. The list of risk factors was also very helpful, as I have always thought asthma was something that individuals are born with.
Natalia Bustamante
Great job, Diana! I loved the way the infographic was designed, especially the colors and the graphs included in the infographic. I do feel like this is a very important topic to talk about, especially since a lot of individuals do suffer from this illness. This infographic was very cohesive and easy to follow and read through. Overall, great job on the infographic, Diana. I genuinely enjoyed reading the information provided.
Alejandra Pardo
The infographic is well presented great job! The color scheme and font chosen fits well. It allows the reader to follow a clear narrative of what information is being presented. I am aware of asthma, but it is interesting to see the highlighted risk and race factors associated with asthma. It is insane to believe that air pollution has become a leading environmental risk for premature death. We tend to be inconsiderate of what we put out on the Earth. The infographic is very informative.
Carina Martinez
This infographic was loaded with information that was very interesting. I believe there could have been a better balance between the graphics and the information provided. I enjoyed how they provided the rates of who asthma affects the most.
Sierra Christa
I loved everything about this infographic! The bold words in the data is a great idea because it grabbed my attention and made me aware of the keywords I needed to know. I also found it very interesting that Native Americans were the ones with the highest asthma rates.
Carlos Alonzo
I like the background and the text used for this info-graphic. The title is well articulated, I like the word “Prevalence”. It was smart to begin the info-graphic with the data and conclude with the treatment and prevention. I like the amount of data used, while the story is ambiguous, the statistics alone are great for the purpose of the info-graphic. Well done.
Jacqueline Galvan
I thought this infographic had a good amount of useful information. It was very informative and made learning about asthma easy and insightful. I also really liked how it discussed the socioeconomic factors with asthma, as I feel factors like poverty, race and ethnicity, and health insurance coverage. Overall, I feel that this infographic was a bit tough to read through but I enjoyed how much I learned from it.
Jacqueline Galvan
I thought this infographic had a good amount of useful information. It was very informative and made learning about asthma easy and insightful. I also really liked how it discussed the socioeconomic factors with asthma, as I feel factors like poverty, race and ethnicity, and health insurance coverage.
Illeana Molina
Hello Diana, I am so happy to be reading this infographic as I do suffer from asthma myself since I was born. It has been a struggle taking medication and feeling my lungs close up is truly painful. I am glad to see individuals such as you interested in medicine shedding light and giving in depth information on asthma in the United States. I did not know that 9 out of ten people are breathing unhealthy/polluted air which is horrible. I think it is crazy how it is found more in adults comapred to children, I am not as informed on asthma statistics and thought it was the other way around. I enjoyed seeing your evaluation of asthma rates by race/ethnicity as well as how insurance companies cover the medical needs. Everything is very expensive if you do not have health insurance and it is unfortunate. I can relate to your infographic and loved all the images, colors and insightful knowledge gained when reading. I like that I feel as if I got enough information as I would reading an essay. Thanky you Diana!!!