Acknowledgements
I would like to express my sincere gratitude to my professors, Dr. Lori Boies and Dr. Rebekah Mahoney, for providing their invaluable guidance, comments, and suggestions throughout the course of the project. I especially want to thank Dr. Boies for constantly inspiring me to work harder, particularly in helping me with how to approach my research. I would also like to thank Dr. Mahoney for showing empathy and teaching me the importance of collaboration and communication.


115 comments
Fernando Milian Leyva
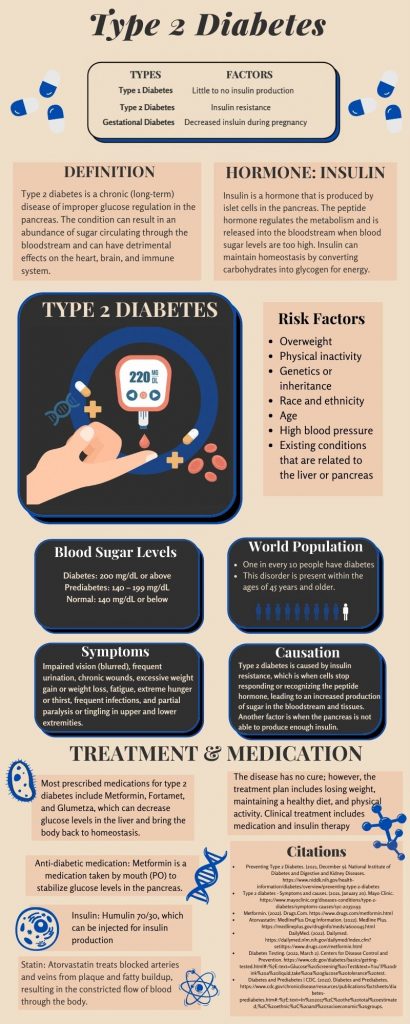
Given that we can never do enough in terms of preventive education, this infographic serves a noble role by contributing to raising awareness in matters such as Diabetes. The information that it presents is accurate and relevant to the topic at hand. The sources are properly cited, and the data is presented in an easy way to understand. However, I believe that the variations in the typography’s size and color do not help to achieve a solid sense of cohesion. Still, it visually works and serves its purpose. Good job!
Gaitan Martinez
America is notorious for being one of the most obese countries on the planet, and being overweight can greatly increase the risk for type 2 diabetes. So as a community, maybe we could support each other by encouraging each other to exercise more? Or eat healthier. Regardless of your weight, it’s extremely beneficial for people to exercise and eat healthy.
Olivia Flores
Hey Muskaan! I really enjoyed your infographic. I really loved to learn about type 2 diabetes as many members in my family have it and I have never fully understood what causes it and how to fix it. I enjoyed the graphics and little images on the side and the colors all matched very well. It was spaced out nicely and the information was overloading but simple and still followable. Overall it was great and informative!
Juan Aguirre Ramirez
This article was very interesting and contained a great deal of important information about type 2 diabetes. The definition was clear and on point by explaining the definition and the process of it. Also, I would suggest putting a little bit more information on risk factors since, while I was reading it, I saw race and ethnicity as one of the factors, making me wonder why. Other than that, the last part of the article was really helpful in explaining the treatment and medication for people with type 2 diabetes.
Karah Renfroe
I enjoyed this infographics thoroughness and attention to detail. The explanation of the definition and key terms was vital since many people are unfamiliar with what exactly the disease is/how it affects the body. In addition, the distinction between the different types of diabetes was also very helpful. The risk factors, along with the accompanying visuals added to the flow of the infographic and made it easy to follow.
Illeana Molina
I enjoyed this infographic as not only does it not display an easy-to-read diagram at the top showing the different types of diabetes you can get as well as what each type does. Many believe that you can get diabetes only from eating too much sugar and carbs; however, it is also a disease that some can be born with diabetes as one’s body can sometimes not produce enough insulin on its own. I am a political science, do not stay informed about other health issues or diseases, and did not know that insulin is a hormone. I enjoyed the chart of the normal levels one should have as that educates individuals of any age on the levels one should have as well as how diabetes affects the world population. This is an excellent infographic as it shows the symptoms, what can cause it, as well as normal levels. I enjoy that it shows the various medications one can take as well as treatments. Everyone should go to the doctor to check if they have diabetes. This is an important infographic as it not only sparks conversation but also gives people the ability to be informed.
Karicia Gallegos
I thought this infographic was very informative. I really liked how the author included the different types of diabetes and the factors that come with each type because most people do not know what each type of diabetes mean. This infographic was very organized and easy to read. I did not know that one in every ten people have diabetes. Overall, the author did a great job!
Alexis Zepeda
Hello! As a child of someone with Diabetes, I know how many may not know the types of this disease. I think it is important to mention that this disease can look and affect people in different ways, but I think in this infographic you have shown the differences well. I also appreciate the color palette of this infographic. I definitely think the blue was a nice pop of color against the pink. The visuals in this infographic also really popped against the pink background. Overall, I think the infographic was well done and informative.
Carina Martinez
I loved how aesthetically pleasing it was visually, and it was also very informational. The infographic included the very important factors of the disease in a straight-to-the-point manner. Very well done to the author!
Naya Harb
The fact that it was an infographic and not a long article made it so much more interesting for me to read. It was really interesting to find out this much about diabetes. I liked learning about the different things that could lead you to have diabetes and also the symptoms you get when you do. I feel like people need to know about this because it might help them prevent getting diabetes or know that they have it. However, I know that diabetes can be a genetic thing.