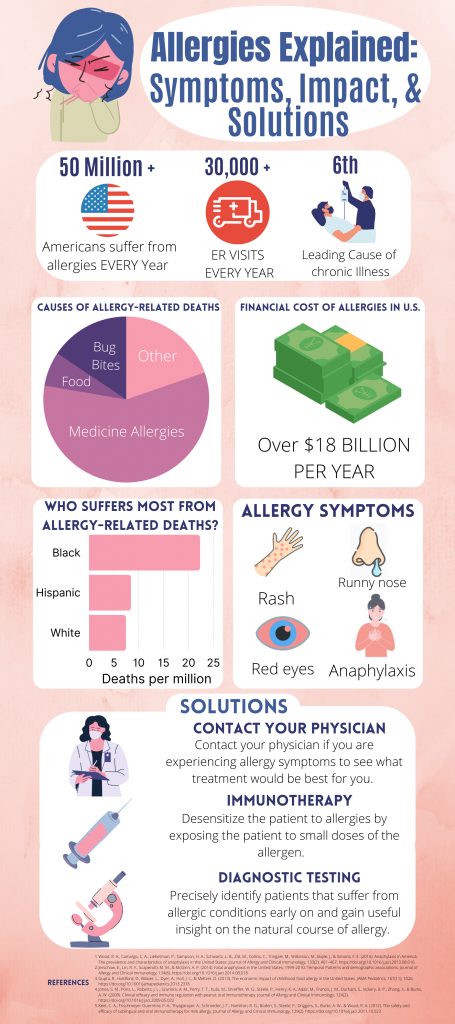
Allergies are a big part of most people’s life. I know for myself I have been highly affected by seasonal allergies as well as medicine allergies. I always find it interesting to see the statistics of how many people are affected by a specific health issue. Your infographic was very informative, and I did not realize it costs over 18 billion dollars (about $55 per person in the US) a year for allergies. Overall, very well done. I enjoy the color scheme and how evenly everything is laid out.
The infographic was quite useful in terms of my own allergy responses. I can relate to allergies since I get them as the weather changes, and it has a huge influence on me with a variety of symptoms. Allergies are certainly a topic that is regularly discussed, but your infographic provided some new information that I was previously ignorant of. Thank you for defining allergies and how they affect individuals.
I really liked this infographic! Growing up, I never suffered from allergies in my hometown. However, after moving here there has been a great increase in my allergies since I moved here about 8 years ago. I think the photos in the infographic are effiecient as well as eye catching!
Hey Adrian what a nice infographic! I loved the color scheme that you choose and all of the coordinating images! I enjoyed this because although it is about allergies, I myself have a sever allergy to peanuts, and while you might not think this earns me a trip to the doctor it definitely does. I have to get bloodwork done twice a year and I have had some cases where I eat something unaware and then have to go to the emergency room. I just think it is important to raise awareness to allergies and how that connects to the healthcare system here in the U.S. Great job!
Very creative and informative infographic! I really loved this infographic, it goes straight to the point, and with the colors, images and fonts it for sure catches one’s attention. I also love how it gives solutions on what an individual can do to get checked and make sure that what they have is allergies, it would have honestly helped me a lot if I saw this when I first moved to San Antonio because there seems to be a lot of allergies here, Great Infographic!
Hey Adrian! Your infographic was awesome, I really liked the colors you chose and the way you organized the information. Allergies are definitely something we hear about a lot, but your infographic showed some interesting facts that I never knew about before. It’s crazy to think that allergies can even be deadly, and that different races are affected differently.
Great infographic Adrian! I hate when allergy season comes around, it makes day to day a little uncomfortable with the symptoms like a runny nose and itch eyes. I like that you provided animations and facts it made following very easy and does a great job at catching attention. I was also surprised to find out that allergies has over an 18 billion dollar cost in the United States.
Such a great infographic with very relevant information. I appreciate the colors and photos and charts very much. I think it is appealing to the eye altogether and flows very well. great job.
I would’ve never imagined that allergies what is the sixth leading cause of death in the United States. Much less that it causes 30,000 ER visits a year. This info graphic has definitely created an intrigue and I’d like to know more of the background behind why black individuals are more likely to die from an allergy related issue. I think there should be more research on this and it would be extremely interesting to address.
This is an amazing article with plenty of detailed infographics about allergies all over the place. With a nice picture combination and explaining the causes of how people get infected by the disease. This is an awesome detail information of allergies in the US. Informing about public health in this graphics with nice color combination with detail information in this explanation. Also graphical representation of people in which category suffer most and solutions. Great work!!!


51 comments
Anna Marie
Allergies are a big part of most people’s life. I know for myself I have been highly affected by seasonal allergies as well as medicine allergies. I always find it interesting to see the statistics of how many people are affected by a specific health issue. Your infographic was very informative, and I did not realize it costs over 18 billion dollars (about $55 per person in the US) a year for allergies. Overall, very well done. I enjoy the color scheme and how evenly everything is laid out.
Emilee Luera
The infographic was quite useful in terms of my own allergy responses. I can relate to allergies since I get them as the weather changes, and it has a huge influence on me with a variety of symptoms. Allergies are certainly a topic that is regularly discussed, but your infographic provided some new information that I was previously ignorant of. Thank you for defining allergies and how they affect individuals.
Bijou Davant
I really liked this infographic! Growing up, I never suffered from allergies in my hometown. However, after moving here there has been a great increase in my allergies since I moved here about 8 years ago. I think the photos in the infographic are effiecient as well as eye catching!
Olivia Flores
Hey Adrian what a nice infographic! I loved the color scheme that you choose and all of the coordinating images! I enjoyed this because although it is about allergies, I myself have a sever allergy to peanuts, and while you might not think this earns me a trip to the doctor it definitely does. I have to get bloodwork done twice a year and I have had some cases where I eat something unaware and then have to go to the emergency room. I just think it is important to raise awareness to allergies and how that connects to the healthcare system here in the U.S. Great job!
Rosa Inocencio
Very creative and informative infographic! I really loved this infographic, it goes straight to the point, and with the colors, images and fonts it for sure catches one’s attention. I also love how it gives solutions on what an individual can do to get checked and make sure that what they have is allergies, it would have honestly helped me a lot if I saw this when I first moved to San Antonio because there seems to be a lot of allergies here, Great Infographic!
Juan Aguirre Ramirez
Hey Adrian! Your infographic was awesome, I really liked the colors you chose and the way you organized the information. Allergies are definitely something we hear about a lot, but your infographic showed some interesting facts that I never knew about before. It’s crazy to think that allergies can even be deadly, and that different races are affected differently.
Yaniev Ibarra
Great infographic Adrian! I hate when allergy season comes around, it makes day to day a little uncomfortable with the symptoms like a runny nose and itch eyes. I like that you provided animations and facts it made following very easy and does a great job at catching attention. I was also surprised to find out that allergies has over an 18 billion dollar cost in the United States.
Analyssa Garcia
Such a great infographic with very relevant information. I appreciate the colors and photos and charts very much. I think it is appealing to the eye altogether and flows very well. great job.
Daniela Garza Martinez
I would’ve never imagined that allergies what is the sixth leading cause of death in the United States. Much less that it causes 30,000 ER visits a year. This info graphic has definitely created an intrigue and I’d like to know more of the background behind why black individuals are more likely to die from an allergy related issue. I think there should be more research on this and it would be extremely interesting to address.
Sudura Zakir
This is an amazing article with plenty of detailed infographics about allergies all over the place. With a nice picture combination and explaining the causes of how people get infected by the disease. This is an awesome detail information of allergies in the US. Informing about public health in this graphics with nice color combination with detail information in this explanation. Also graphical representation of people in which category suffer most and solutions. Great work!!!