
I would like to thank Professor Dr. Boies and my classmates for assisting my editorial process to improve this infographic. I would like to thank StMU Research Scholars for giving the opportunity to be able to publish my work. Finally, I would also like to acknowledge the authors whose research supported the development of this work.
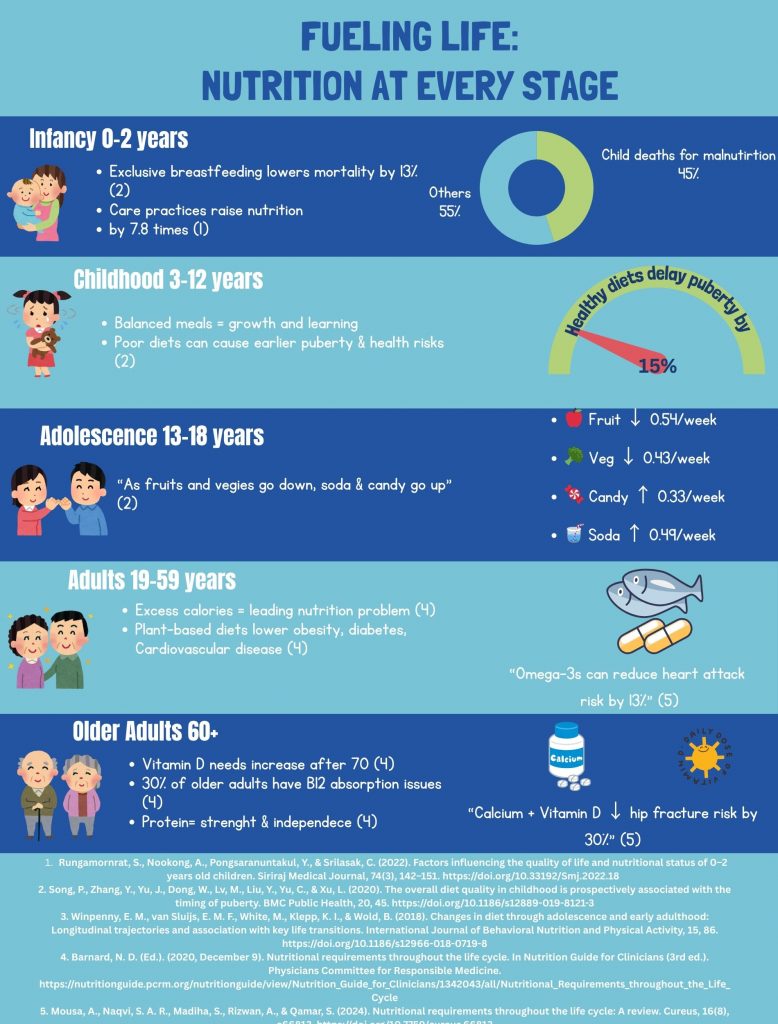
Rungamornrat, S., Nookong, A., Pongsaranuntakul, Y., & Srilasak, C. (2022).
Song, P., Zhang, Y., Yu, J., Dong, W., Lv, M., Liu, Y., Yu, C., & Xu, L. (2020).
Winpenny, E. M., van Sluijs, E. M. F., White, M., Klepp, K. I., & Wold, B. (2018).
Barnard, N. D. (Ed.). (2020, December 9).
Mousa, A., Naqvi, S. A. R., Madiha, S., Rizwan, A., & Qamar, S. (2024).

2 comments
bvelezramos
I really enjoy how this infographic shows what the health risks are to poor diets in certain age groups. I also like how it shows the benefits of having a good diet within your age group. I believe this infographic shows the reality and brings awareness to maintain a good healthy diet as there can be health risks that can arise from a poor diet. It also shows how in older age there needs to be more vitamin intake.
Britney Velez Ramos
I really enjoy how this infographic shows what the health risks are to poor diets in certain age groups. I also like how it shows the benefits of having a good diet within your age group. I believe this infographic shows the reality and brings awareness to maintain a good healthy diet as there can be health risks that can arise from a poor diet. It also shows how in older age there needs to be more vitamin intake.