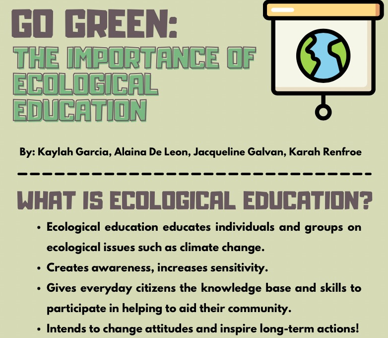
I really enjoyed this infographic. This has to do with Civic Engagement in a way that being able to educate an audience or a community about ecological education requires the contribution of many individuals to make this happen. I think that this infographic is good with getting the message across by balancing the use of both images and text. What stood out to me was the use of images and what I would improve on is maybe to try and make it a little shorter.
Amazing poster! I feel the segmenting helped my eyes flow through the poster and find the impacts and need for me to use the information that was displayed! Though I question the amount of time being used to make such an amazing piece of work? was the design all hand drawn and if so do you think this way of work is plausible with problems that require more text?
Amazing poster!, I feel the segmenting helped my eyes flow through the poster and find the impacts and need for me to use the information that was displayed! Though I question the amount of time being used to make such an amazing piece of work? was the design all hand drawn and if so do you think this way of work is plausible with problems that require more text?
First of all, great infographic. The way that everything is organized and looks clean goes to show that you guys put the time and effort into this. I really liked your topic of ecological education. I feel like this is a topic that needs to be spreads out more to the public so we can be more educated on how we can take care of our planet. Overall, I like the use of images and the use of text in a way that does not look too clustered together.
Congratulations on the nomination! The infographic was visual very appealing and went along great with the information that was given. The infographic was well organized and I loved the different elements and sections that was presented. I’ve done numerous presentations on climate change and the information given was short and sweet, but hit all the important parts that needed to be portrayed. Overall great work.
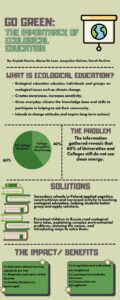
This infographic was very informative. In my opinion it is very simple and gets to the point and honestly I feel like more people will listen and read when it’s straight to the point. Also love the way the problem is mention and even provided 2 solutions that other schools use. Hopefully one day we can get all school to participate in recycling instead of only 62%.
I actually really enjoyed this infographic, it has very important information about ecological education. I was very surprised by the statistic that more than half of all institutions dont use clean energy. In terms of the layout and visuals I was very pleased, the format of info, problem and solution is very good and makes the infographic very easy to read.
Congratulations on the award! This infographic is simple and wasn’t confusing or too much and it is straight to the point. I liked the colors that were used for the infographic, and the font especially the title. I also thought the graph was important because it shows the percentages of college campuses that do or don’t use clean energy. Overall, awesome job!
I really enjoy seeing ecology advocacy in our school, thank you. The infographic was well organized and the design and graphics were nice and clean. The example of the Russian children learning ecology through fairy tales could easily be implemented in all schools. It also shows how early these lessons can be taught. The nature-consciousness that ecology promotes should be instilled from a young age if we want to educate the population. Ecological education also boosts imagination and enthusiasm? That is more proof that it should be implemented in early education.
The infographic was very easy to read and gave lots of information on an Ecological Education. I think it might need just a bit more information maybe some definition to different ways that they were able to develop an Eco friendly learning environment.


53 comments
Eduardo Saucedo Moreno
Hello,
I really enjoyed this infographic. This has to do with Civic Engagement in a way that being able to educate an audience or a community about ecological education requires the contribution of many individuals to make this happen. I think that this infographic is good with getting the message across by balancing the use of both images and text. What stood out to me was the use of images and what I would improve on is maybe to try and make it a little shorter.
Daniel Gutierrez
Amazing poster! I feel the segmenting helped my eyes flow through the poster and find the impacts and need for me to use the information that was displayed! Though I question the amount of time being used to make such an amazing piece of work? was the design all hand drawn and if so do you think this way of work is plausible with problems that require more text?
Daniel Gutierrez
Amazing poster!, I feel the segmenting helped my eyes flow through the poster and find the impacts and need for me to use the information that was displayed! Though I question the amount of time being used to make such an amazing piece of work? was the design all hand drawn and if so do you think this way of work is plausible with problems that require more text?
Eduardo Saucedo Morenio
Hey!
First of all, great infographic. The way that everything is organized and looks clean goes to show that you guys put the time and effort into this. I really liked your topic of ecological education. I feel like this is a topic that needs to be spreads out more to the public so we can be more educated on how we can take care of our planet. Overall, I like the use of images and the use of text in a way that does not look too clustered together.
Lauren Sahadi
Congratulations on the nomination! The infographic was visual very appealing and went along great with the information that was given. The infographic was well organized and I loved the different elements and sections that was presented. I’ve done numerous presentations on climate change and the information given was short and sweet, but hit all the important parts that needed to be portrayed. Overall great work.
Johana Solís
This infographic was very informative. In my opinion it is very simple and gets to the point and honestly I feel like more people will listen and read when it’s straight to the point. Also love the way the problem is mention and even provided 2 solutions that other schools use. Hopefully one day we can get all school to participate in recycling instead of only 62%.
Luis Dena
I actually really enjoyed this infographic, it has very important information about ecological education. I was very surprised by the statistic that more than half of all institutions dont use clean energy. In terms of the layout and visuals I was very pleased, the format of info, problem and solution is very good and makes the infographic very easy to read.
Ana Barrientos
Congratulations on the award! This infographic is simple and wasn’t confusing or too much and it is straight to the point. I liked the colors that were used for the infographic, and the font especially the title. I also thought the graph was important because it shows the percentages of college campuses that do or don’t use clean energy. Overall, awesome job!
Joseph Sanchez
I really enjoy seeing ecology advocacy in our school, thank you. The infographic was well organized and the design and graphics were nice and clean. The example of the Russian children learning ecology through fairy tales could easily be implemented in all schools. It also shows how early these lessons can be taught. The nature-consciousness that ecology promotes should be instilled from a young age if we want to educate the population. Ecological education also boosts imagination and enthusiasm? That is more proof that it should be implemented in early education.
Vianna
The infographic was very easy to read and gave lots of information on an Ecological Education. I think it might need just a bit more information maybe some definition to different ways that they were able to develop an Eco friendly learning environment.