Hello! My name is Andrea Realyvasquez and I am in my senior year here at St. Mary's University, studying to receive a bachelor's degree in Environmental Science and Sustainability. If you are more interested in my other works feel free to click on my profile!
This infographic stood out to me because it successfully uses data and visual design to communicate an important message about civic engagement. I appreciated how the charts and layout made the information accessible and impactful. One suggestion for improvement would be to include citations or sources directly on the infographic to strengthen the credibility of the data presented. Overall, this was a powerful, enterteining and well-designed piece.
This infographic stood out to me because it successfully uses data and visual design to communicate an important message about civic engagement. Although the topic is not strictly life sciences, the clear presentation of statistics reflects strong STEM communication skills. I appreciated how the charts and layout made the information accessible and impactful. One suggestion for improvement would be to include citations or sources directly on the infographic to strengthen the credibility of the data presented. Overall, this was a powerful and well-designed piece.
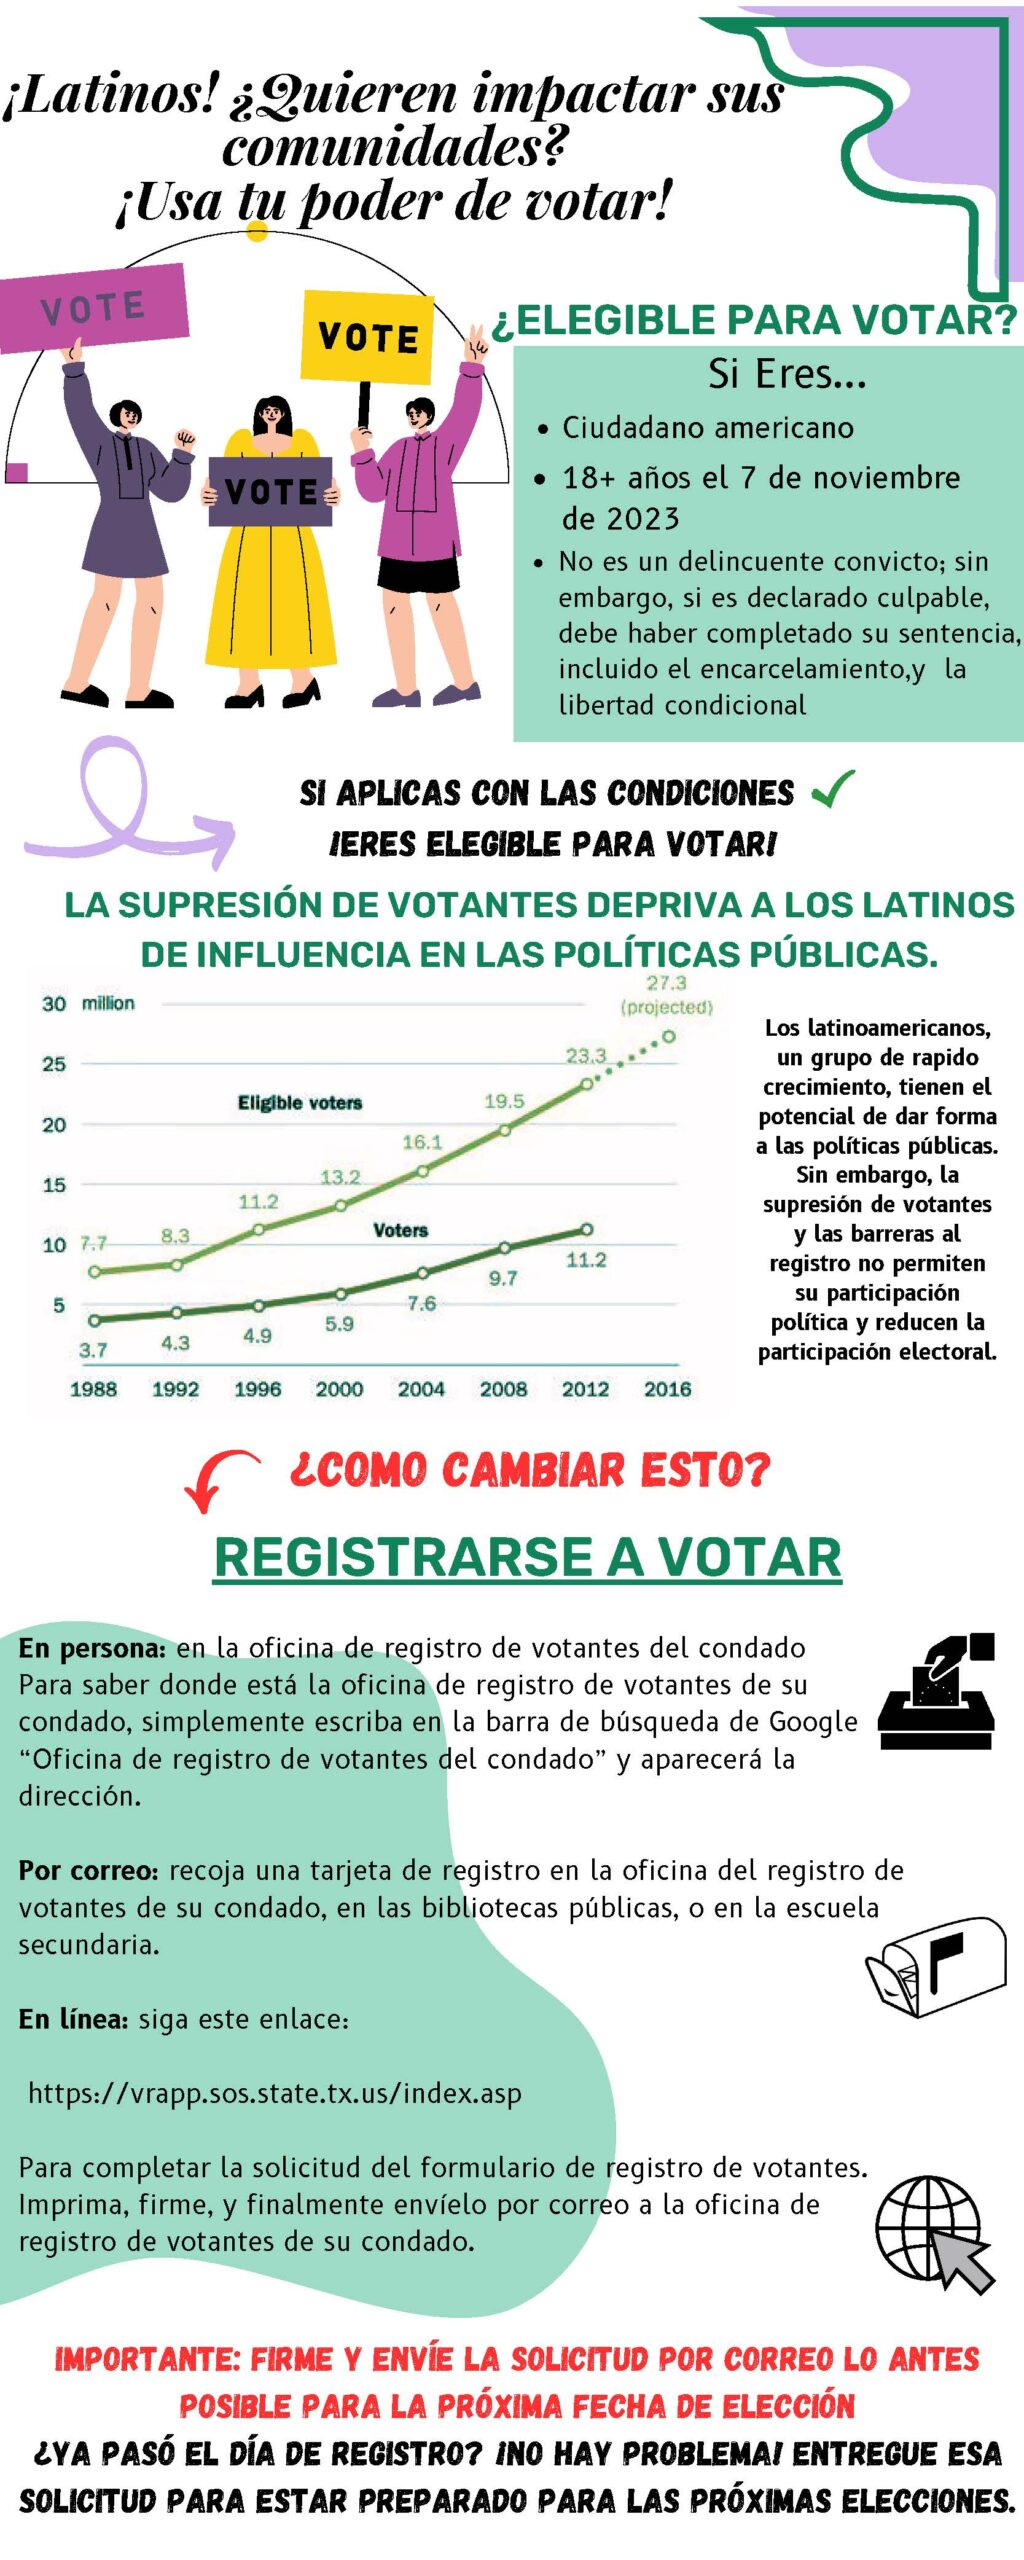
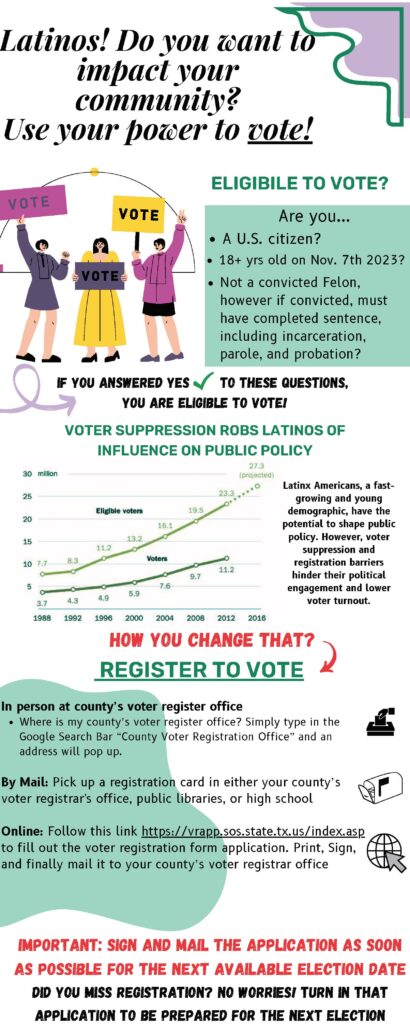
The Spanish translation of this infographic is a wonderful touch, I love the inclusivity! It is imperative that we acquire diversity in the voting pool, especially with Latinx being impacted by much of the legislature at disproportionate rates. Adding the statistics is a great way to call to action and push the youth as a whole to vote, alongside the Latinx population.
Wow! What a cool infographic! I was not familiar with some of the requirements you mentioned to be able to vote. It was surprising to read that if you are convicted of a felony, you must finish your sentence to be able to vote. I also loved that you had a lot of images and QR codes. QR codes are a great idea to engage with the audience after informing them of things like this. Tambien me Encanto que agregaste la version en espanol, siento que hasta puede tener mas impacto y llegar a mas gente. Felicidades, muy lindo trabajo.
This infographic told us to vote more which is important for our society. People should engage more on their communities and should vote actively. This infographic was well organized and had nice summary of what it’s trying to say.
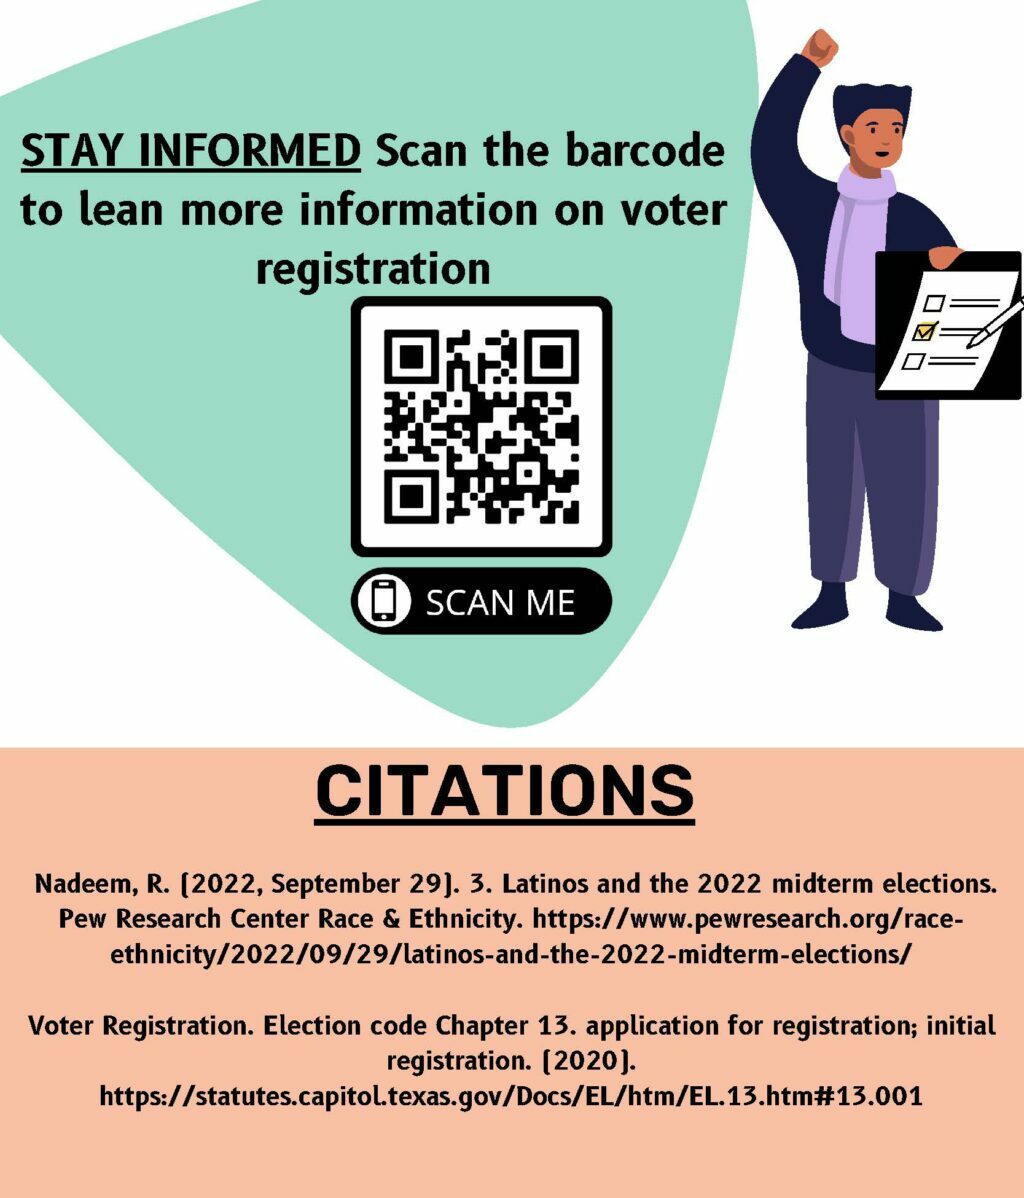
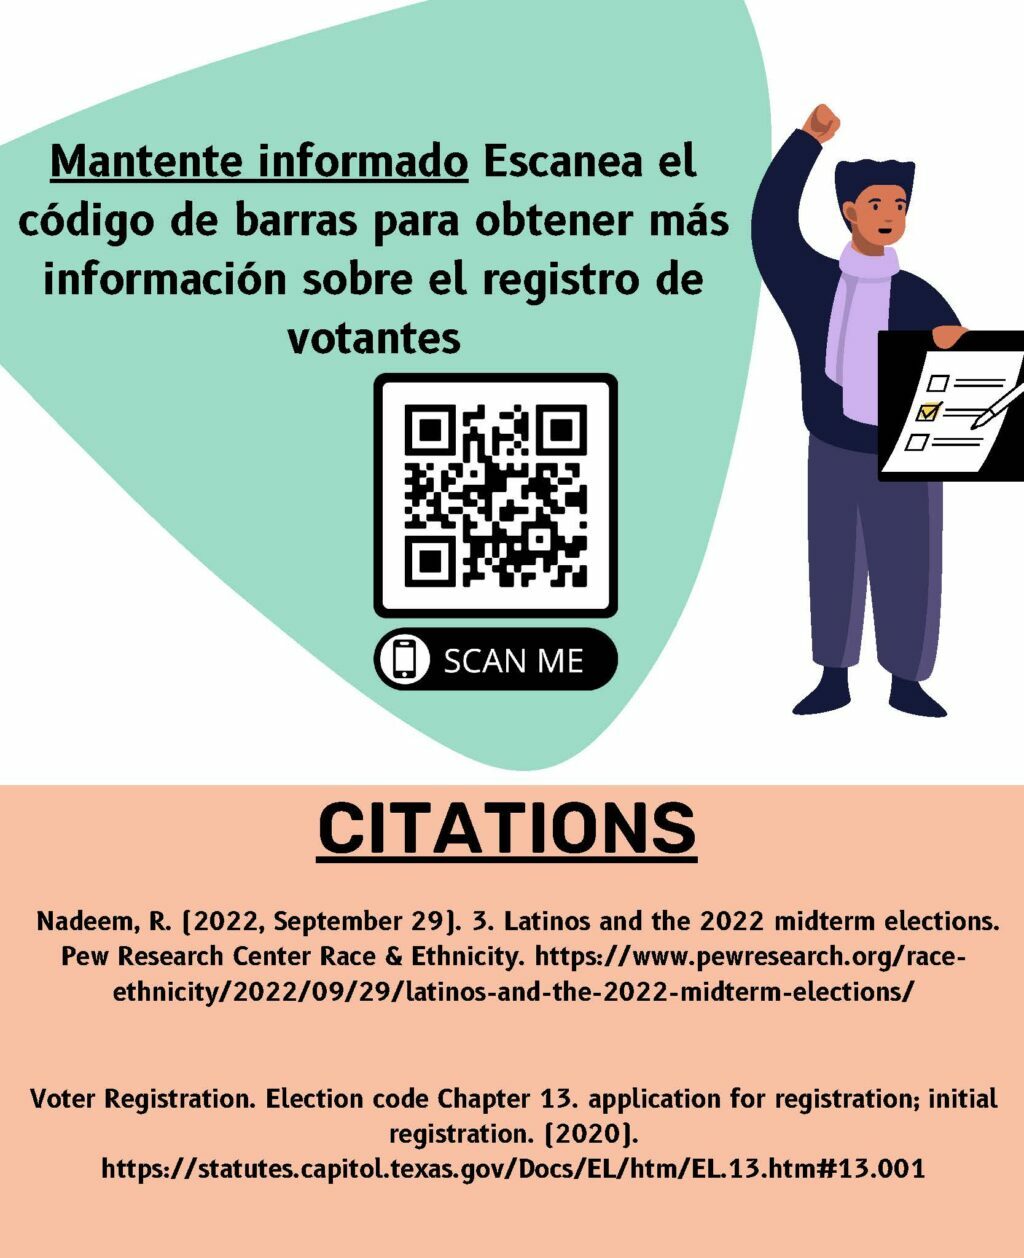
Good evening, Andrea. I hope you’re well. Given the lovely colors, design, and context, I admire this infographic. You also highlighted the Spanish and English infographics, which are essential in today’s growing Hispanic and Latino population and society. The infographic is vital for individuals to understand voting and how they may become eligible to vote. As you indicated, Latinos are more likely to be unable to vote because of their status in the United States. I would have liked to see more information about how Latinos are being denied their voting rights, such as limits at polling places or discrimination. I can indeed identify with this infographic because both of my parents are Mexican and are eager to work hard to create and enforce public policy. My mother has been an excellent role model because she consistently pushes me and others to get civically active and volunteer to assist the community, whether via voting, volunteering, or public service. I like how you included a QR code so people can instantly access the website and learn about the voter registration procedure. Overall, this infographic helped me understand how to vote and what it signifies in the Latino community.
Amazing! I love how this infographic can appeal to more people by providing the information in both Spanish and English. It is crucial that everyone exercises their right to vote, but not everyone knows how. This infographic does an excellent job on highlighting how to end voter suppression by explaining who qualifies to vote and how to register to vote.
Voting is a important thing that many take for granted these days. I thought including the idea of how voter suppression is in regards to Latino voting works well with what the infographic is trying to say, but I think this could have been done with text a bit better than a graph. Some wording also could have been condensed and be put more as two things than one. However you were still able to address the point on why voting should be important to us and how we should tackle the issue in and of itself.
The infographic graphics were so helpful and nicely colored. I enjoyed the fact that it was written in Spanish and English. I believe translating them is helpful and makes them more accessible to people. I enjoyed the different ways of voting provided for people who may not be familiar with it. Wonderful job Andrea!


26 comments
Jaidelin Alvarado
This infographic stood out to me because it successfully uses data and visual design to communicate an important message about civic engagement. I appreciated how the charts and layout made the information accessible and impactful. One suggestion for improvement would be to include citations or sources directly on the infographic to strengthen the credibility of the data presented. Overall, this was a powerful, enterteining and well-designed piece.
Jaidelin Alvarado
This infographic stood out to me because it successfully uses data and visual design to communicate an important message about civic engagement. Although the topic is not strictly life sciences, the clear presentation of statistics reflects strong STEM communication skills. I appreciated how the charts and layout made the information accessible and impactful. One suggestion for improvement would be to include citations or sources directly on the infographic to strengthen the credibility of the data presented. Overall, this was a powerful and well-designed piece.
Elizabeth Santos
The Spanish translation of this infographic is a wonderful touch, I love the inclusivity! It is imperative that we acquire diversity in the voting pool, especially with Latinx being impacted by much of the legislature at disproportionate rates. Adding the statistics is a great way to call to action and push the youth as a whole to vote, alongside the Latinx population.
pgarcia58
Wow! What a cool infographic! I was not familiar with some of the requirements you mentioned to be able to vote. It was surprising to read that if you are convicted of a felony, you must finish your sentence to be able to vote. I also loved that you had a lot of images and QR codes. QR codes are a great idea to engage with the audience after informing them of things like this. Tambien me Encanto que agregaste la version en espanol, siento que hasta puede tener mas impacto y llegar a mas gente. Felicidades, muy lindo trabajo.
igutierrez14
Good infographic, easy to read, has all the essential information on learning how to register to vote.
LEE
This infographic told us to vote more which is important for our society. People should engage more on their communities and should vote actively. This infographic was well organized and had nice summary of what it’s trying to say.
egonzalez95
Good evening, Andrea. I hope you’re well. Given the lovely colors, design, and context, I admire this infographic. You also highlighted the Spanish and English infographics, which are essential in today’s growing Hispanic and Latino population and society. The infographic is vital for individuals to understand voting and how they may become eligible to vote. As you indicated, Latinos are more likely to be unable to vote because of their status in the United States. I would have liked to see more information about how Latinos are being denied their voting rights, such as limits at polling places or discrimination. I can indeed identify with this infographic because both of my parents are Mexican and are eager to work hard to create and enforce public policy. My mother has been an excellent role model because she consistently pushes me and others to get civically active and volunteer to assist the community, whether via voting, volunteering, or public service. I like how you included a QR code so people can instantly access the website and learn about the voter registration procedure. Overall, this infographic helped me understand how to vote and what it signifies in the Latino community.
Alexis Silva
Amazing! I love how this infographic can appeal to more people by providing the information in both Spanish and English. It is crucial that everyone exercises their right to vote, but not everyone knows how. This infographic does an excellent job on highlighting how to end voter suppression by explaining who qualifies to vote and how to register to vote.
Azariel Del Carmen
Voting is a important thing that many take for granted these days. I thought including the idea of how voter suppression is in regards to Latino voting works well with what the infographic is trying to say, but I think this could have been done with text a bit better than a graph. Some wording also could have been condensed and be put more as two things than one. However you were still able to address the point on why voting should be important to us and how we should tackle the issue in and of itself.
Silvia Benavides
The infographic graphics were so helpful and nicely colored. I enjoyed the fact that it was written in Spanish and English. I believe translating them is helpful and makes them more accessible to people. I enjoyed the different ways of voting provided for people who may not be familiar with it. Wonderful job Andrea!