Acknowledgements
I would like to express my sincere gratitude to my professors, Dr. Lori Boies and Dr. Rebekah Mahoney, for providing their invaluable guidance, comments, and suggestions throughout the course of the project. I especially want to thank Dr. Boies for constantly inspiring me to work harder, particularly in helping me with how to approach my research. I would also like to thank Dr. Mahoney for showing empathy and teaching me the importance of collaboration and communication.


115 comments
Jacqueline Galvan
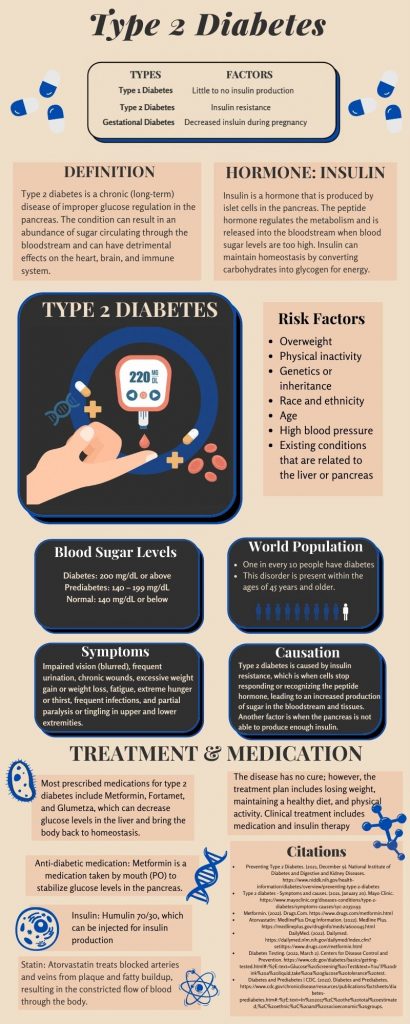
I liked the way this infographic was formatted. Diabetes is a very complex disease, and I felt that this infographic clearly depicted the disease in all its forms. I also liked how the graphics were cohesive and the infographic flowed very easily to best comprehend the information that was being presented. I also thought that the information was very concise and to the point.
Alaina De Leon
This infographic was pleasing to look at and also carried a lot of information. It was content heavy but still kept me engaged whilst reading it. The muted tones made the blue hints stick out more which made it easy to look at. My favorite part would have to be the risk factors section. It has a visual to look at and a neat list directly next to it that makes it easy to read. Overall I enjoyed this infographic and the facts on it.
Mia Garza
This infographic was very informative about the basics of type 2 diabetes as well as the treatments and medication. I believe that it was able to provide great information on what type 2 diabetes is and its impact on individuals who have to deal with it daily. It also brings awareness to Type 2, as I know diabetes as a whole is stigmatized.
Joseph Frausto
Interesting format! Coming from a family with several members suffering from this disease, I was not expecting to learn much more than I already knew; however, the information that was present directly and thoroughly in this infographic taught me something new! I particularly enjoyed the information about the different treatment options at the end as they provided specific information that could be vital and eye opening to someone new to dealing with diabetes.
Carlos Alonzo
Your info-graphic is well organized and has the necessary information to understand the topic, good job! It would be bad if people did not treat their disease and therefore your info-graphic does great at informing people about the symptoms and treatment available. For constructive criticism I will point to Risk Factors, since such factors are not always associated with diabetes and can be misleading unless medically prescribed by a specialist.
Alexander Garcia
I really enjoyed the way this infographic conveyed the information, because it was in a very direct way. Although I liked the information that was presented, I was not very fond of the format because it was sort of confusing to me. However ,overall I truly enjoyed this infographic because the information it provided was very useful and informative. I did not know much about type 2 diabetes before reading this infographic, but now i can honestly say i know quite a lot
Victoria Dubois
Very well-written and well-presented infographic! The information was put in the correct order to read helping you understand type 2 diabetes by going the infographic. I really loved how you explained what is was, then the symptoms that it can give you and then lastly the treatments and medications. The order it was presented to us in this poster was amazing. Good Job!
Esmeralda Gomez
I really love this infographic! The colors are very professional, and actually very pleasing to look at. The dark text boxes are one of my favorites to look at. The icons that you chose are very cutesy, I love the design of them. I think you did an amazing job at creating this infographic! The information is also very good; the infographic does an amazing job of breaking down information to make it more accessible to others.
Maximillian Morise
Thank you for this infographic! I enjoyed the info-box explaining the Insulin hormone in depth and how it works, as well as the other scientific data that was posted alongside your info. My only recommendation would be to make sure that that pictures and graphical images you use in this infographic don’t fade into the background, as well as careful use of your language not because it is incorrect, but because scientific lingua franca can be confusing to the average person viewing this infographic. Nonetheless, a job very well done.
Jonathan Flores
This was definitely an extremely informative infographic which is always great, and the true purpose of a graphic. I really liked how you presented such a serious topic in a manner that is very educational while still giving the reasons and ways to keep a serious disease away. Just to add some small pointers that I think could elevate your graphic, I think that, while the graphic is aesthetically pleasing, the large picture in the middle takes away from the information because it is very large. So, I would just say to make the words larger and the picture smaller would help but, in any case, the infographic is very well done!