
Acknowledgements:
I would like to thank Dr. Lori Boies for her help in the early stages of this project, particularly in helping me find a topic I am passionate about. I am most grateful to my parents for their encouragement to help me to see the importance of this project for how it could be helpful and useful to others in need of information.


60 comments
Emilee Luera
The information provided is straightforward. The approach used is ideal for explaining the problem and, eventually, preventative strategies and options for assistance. Despite its relevance, I believe that childhood obesity is underrepresented in educational contexts. It’s intriguing to realize that low-cost food does not contain the proper nutritional value for youngsters. This was an interesting article to read because it highlighted child obesity and how it might impact a child’s health.
Bijou Davant
Something that has always been an issue in America is obesity. A lot of our adult lives are impacted by choices made in our childhood, so obesity has always been one we have wanted to avoid. Knowing the risks and impact of childhood obesity can bring the rates down. This infographic does a great job of informing people of the impact!
Rosa Inocencio
Very interesting and informative infographic! I really liked that this infographic touched base on a topic that is very common nowadays especially since I myself was considered obese my whole childhood. I also really liked that you brought up how at times it is at times the home one is living in that makes the child obese because it is honestly true and it is proven to be true, Great Infographic!
Yaniev Ibarra
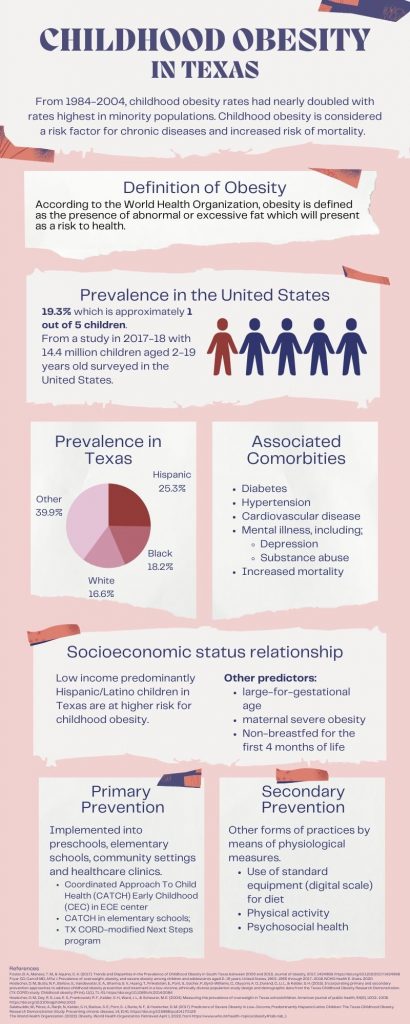
Neat infographic Xena! Child obesity in Texas is an increasing at a noticeable rate and as your pie chart shows it is prevalent in the Hispanic community predominantly in low income households which does not take me by surprise. The food available at a lower expense does not have the proper nutritional values for children, it is interesting to think about.
Analyssa Garcia
Okay first, this infographic is so pretty! I like it a lot. I think that 1. of course the information is very important and it is displayed well. 2. the font, sizes, color, everything works very nicely. good job.
Daniela Garza Martinez
Childhood obesity is an issue that I believe isn’t addressed enough in educational environments and it is so important. To think that 1 in 5 children is a victim to this is concerning. It is great that this issue was able to be addressed in complete respect and in no way enforcing fat phobia. We must be able to implement this knowledge from younger years to be able to prevent these issues.
Sudura Zakir
Obesity is very common in the present context which results in different kinds disease in human body. One of the major disease is hypertension, diabetes, high mortality rate, depression which is from mental illness, blood pressure these are the consequences people facing right now. Perfect representation of the whole article and I really enjoyed the detail information with diseases with prevention and socio-economic status. Awesome work in the infographic.
Xavier Bohorquez
The data and point of view in this infographic were very interesting and I really liked it a lot. It’s interesting to see how obesity really does affect childhoods as a whole and for someone who grew up on the brink of obesity, I can see how this data would measure up to a personal experience. Your own inclusions of preventions and visible data made this even more eye captivating.
Alejandra Pardo
The infographic has very interesting data and points. The format used is great at displaying the issue and in the end ways of prevention and resources. Great article overall covering issues seen throughout children, it’s interesting to see how predictors like being breastfed in the first months of birth can affect a child in a positive way. Wow. This infographic gives a better way of understanding obesity in children.
Fernando Milian Leyva
After observing this infographic for a couple of minutes, with causal eyes, without wanting to be critical, I learned something new. In fact, I learned some things totally new to me. And that speaks of the tremendous success that the chart accomplish. The data presented is super easy to interpret. The color scheme is subtle yet inviting, which makes it accessible and visually appealing. The references on the bottom add much credibility and are arranged in a proper format. I enjoyed this piece of illustration. It is very informative and well-presented.