Hello! My name is Andrea Realyvasquez and I am in my senior year here at St. Mary's University, studying to receive a bachelor's degree in Environmental Science and Sustainability. If you are more interested in my other works feel free to click on my profile!
Wow! I really enjoyed going through you infographic, I found that I found myself drawn to the images you provided. I liked how fun they were. It brought the whole infographic together really well! I really love how you made this infographic bilingual, not many authors do this but seeing it done here makes your infographic really stand out compared to others.
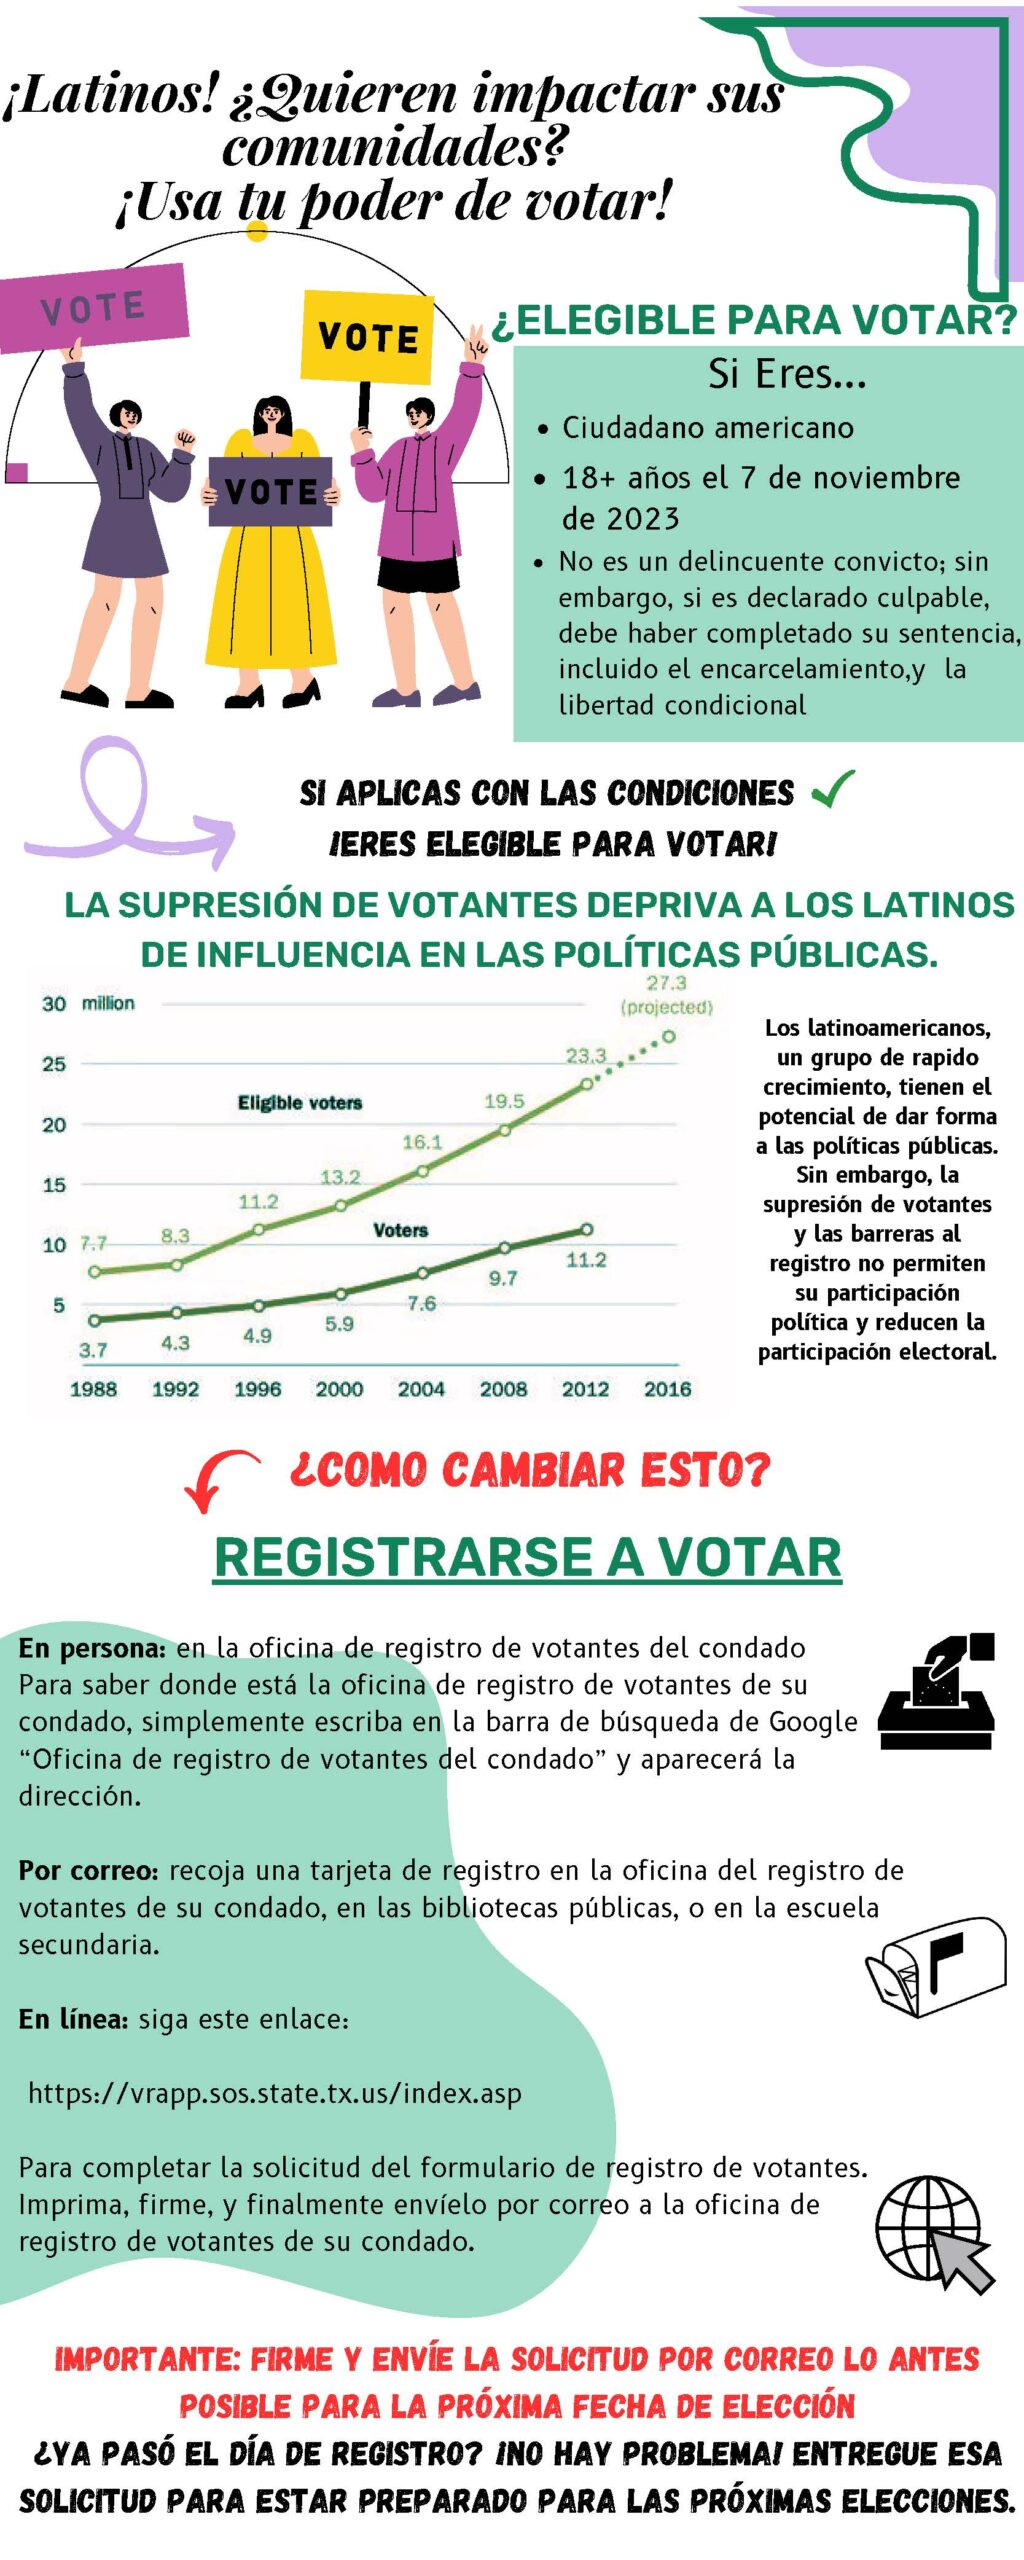
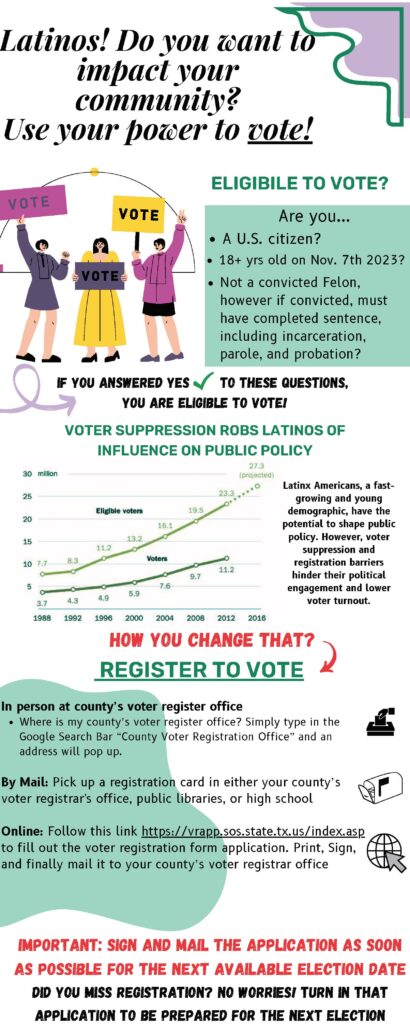
Effective infographic, has lots of information and effective use of images to represent the text and spirit of the infographic. Including the requirements to vote and what disqualifies you was important as well as how you can vote either in person or by mail. Voting is one of the most important uses of civic engagement as well as one of the simplest. The use of color and small icons really ties the whole infographic together leaving minimal white space and getting the message across.
Loved the title of your infographic Andrea! Thank you for providing a Spanish translation as well. As someone who voted for the first time this November, I felt like I was making a change even though I know it takes a community to make a change, but just by doing something I felt like I did my part. I hope others know how important it is to vote and even if they cannot vote they can promote things on social media.
I loved this infographic, I thought the colors were bright and the message overall was great! The colors, pictures/icons made the message fun and exciting to read! I also enjoyed how it targeted specifically Latinos and how they can change voter suppression, and also using a graph to show voter suppression will make an impact on Latinos to go out and vote. Overall, amazing job!
I really liked your infographic the graphics were nice. Well done! I enjoyed the topic it is similar to my groups infographic. We are putting out focus to people of color and how their voice and vote matters. I enjoyed reading both in Spanish and in English it was well informative and pretty to look at. I can tell you put a lot of hard work into this infographic.
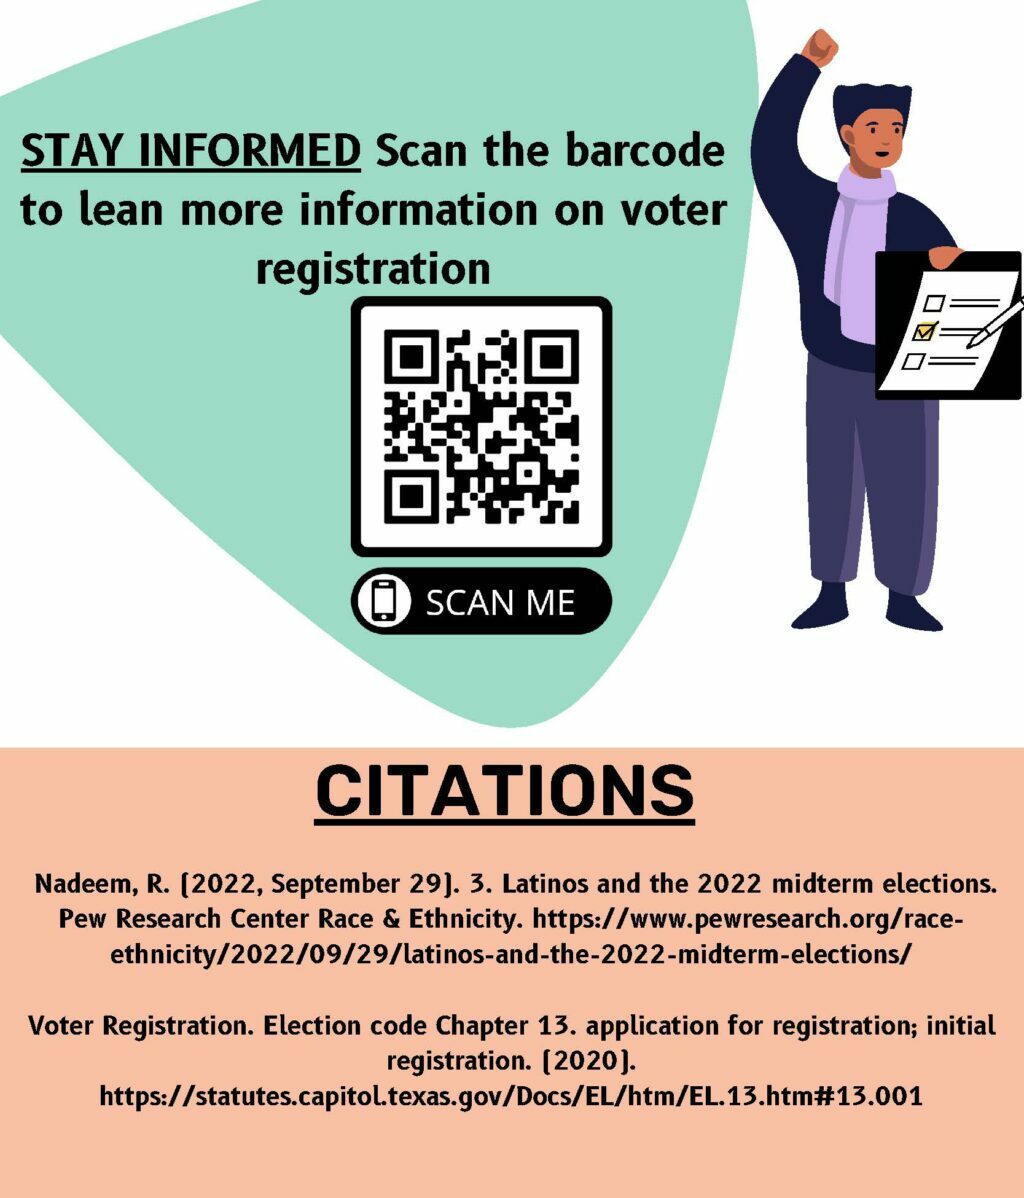
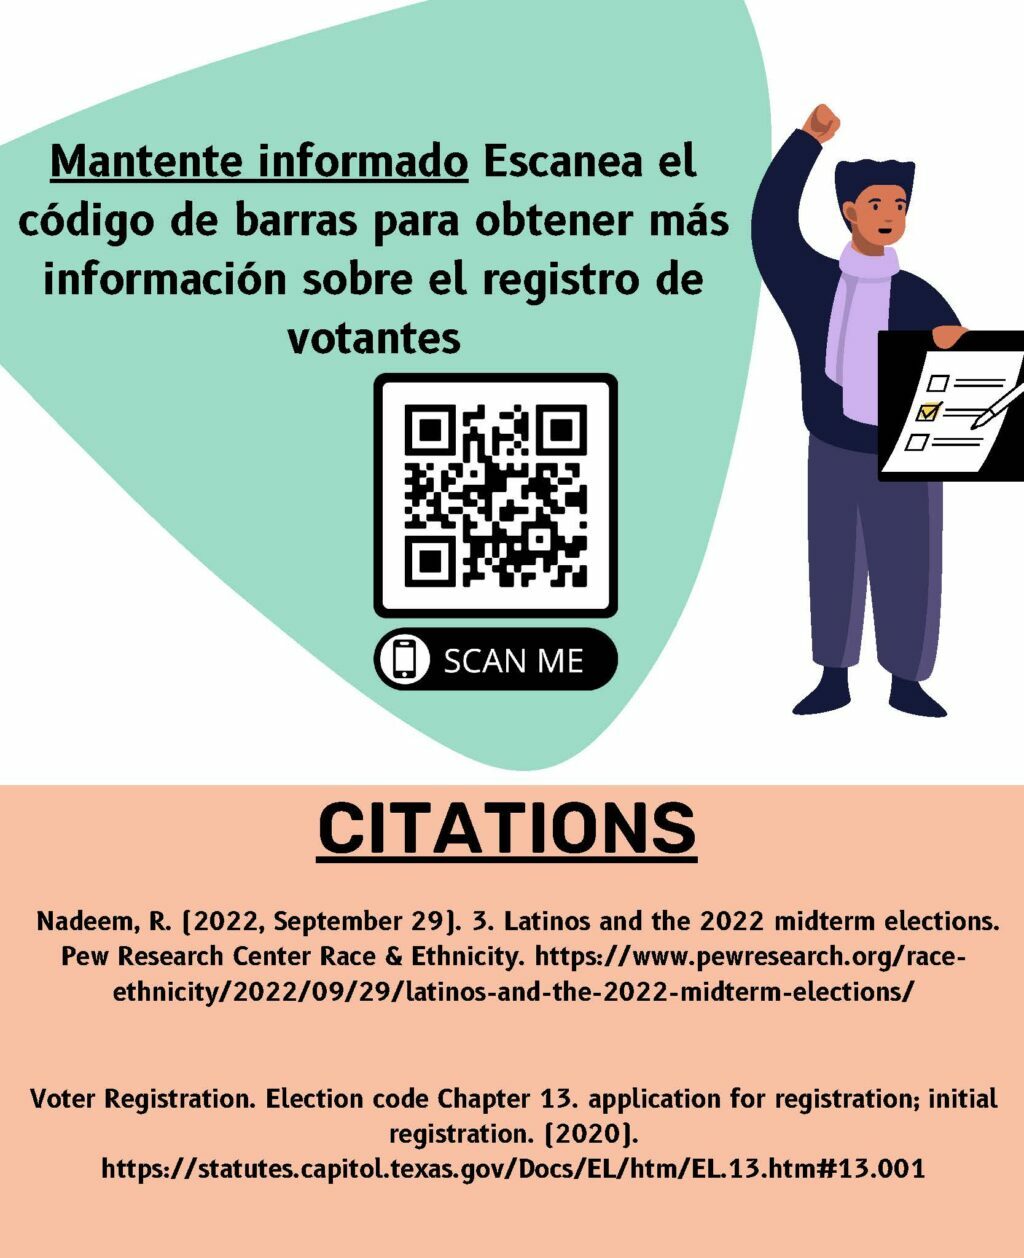
Awesome job on the infographic. The infographic urges you to take part in change in your community. The color scheme is pleasing to the reader. The infographic takes you step by step from the qualifications to vote, statistical reasoning, and action. The QR code on how the reader can stay informed was an excellent addition. I appreciate the Spanish interpretation of the infographic for bilingual readers. Excellent job Andrea!
Engaging infographic. The infographic urges you to take part in change in your community. The color scheme is pleasing to the reader. The infographic takes you step by step from the qualifications to vote, statistical reasoning, and action. The QR code on how the reader can stay informed was an excellent addition. I appreciate the Spanish interpretation of the infographic for readers more comfortable receiving the information in Spanish.
Hello, Andrea! Thank you for addressing such an important matter facing our community and nation as a whole! Voter suppression is real and something that not a lot of people are aware is happening. I really appreciated the inclusion of the graph highlighting the fact that Latinos truly hold so much power in our numbers. If all of the eligible Latinos secured their vote when elections come around, I truly believe that we’d be able to make a significant change. And what better way to show up for each other and our rights than at the polls? I also thought that it was great how you provided a QR code at the bottom of your infographic so that people are able to become even more informed. Overall great job on this, it’s clear that a lot of work and effort was put in.
The colors were very vivid and eye catching. The infographic was slightly clustered. Some elements didn’t fit in the theme of the infographic. Other than that the information was great and the point got across clearly. I liked the layout of the information. The way you started out with if you’re eligible to vote, then statistics, then how you can change that was really nice.
I think it’s great that your infographic is voiced so enthusiastically and encouraging. Some people can treat voting as a boring thing, but you made it seem exciting, which it is! It’s great that you provided a Spanish version of your graphic, especially after stating how important the Latino vote is. The links you provided and the QR code make it simple and easy to sign up and get registered. Awesome job Andrea.


26 comments
Julieta Cortez
Wow! I really enjoyed going through you infographic, I found that I found myself drawn to the images you provided. I liked how fun they were. It brought the whole infographic together really well! I really love how you made this infographic bilingual, not many authors do this but seeing it done here makes your infographic really stand out compared to others.
Daniel Olivares
Effective infographic, has lots of information and effective use of images to represent the text and spirit of the infographic. Including the requirements to vote and what disqualifies you was important as well as how you can vote either in person or by mail. Voting is one of the most important uses of civic engagement as well as one of the simplest. The use of color and small icons really ties the whole infographic together leaving minimal white space and getting the message across.
Johana Solís
Loved the title of your infographic Andrea! Thank you for providing a Spanish translation as well. As someone who voted for the first time this November, I felt like I was making a change even though I know it takes a community to make a change, but just by doing something I felt like I did my part. I hope others know how important it is to vote and even if they cannot vote they can promote things on social media.
Ana Barrientos
I loved this infographic, I thought the colors were bright and the message overall was great! The colors, pictures/icons made the message fun and exciting to read! I also enjoyed how it targeted specifically Latinos and how they can change voter suppression, and also using a graph to show voter suppression will make an impact on Latinos to go out and vote. Overall, amazing job!
Amarie Pollard
I really liked your infographic the graphics were nice. Well done! I enjoyed the topic it is similar to my groups infographic. We are putting out focus to people of color and how their voice and vote matters. I enjoyed reading both in Spanish and in English it was well informative and pretty to look at. I can tell you put a lot of hard work into this infographic.
Linda Aguilar
Awesome job on the infographic. The infographic urges you to take part in change in your community. The color scheme is pleasing to the reader. The infographic takes you step by step from the qualifications to vote, statistical reasoning, and action. The QR code on how the reader can stay informed was an excellent addition. I appreciate the Spanish interpretation of the infographic for bilingual readers. Excellent job Andrea!
Linda Aguilar
Engaging infographic. The infographic urges you to take part in change in your community. The color scheme is pleasing to the reader. The infographic takes you step by step from the qualifications to vote, statistical reasoning, and action. The QR code on how the reader can stay informed was an excellent addition. I appreciate the Spanish interpretation of the infographic for readers more comfortable receiving the information in Spanish.
Haley Aleman
Hello, Andrea! Thank you for addressing such an important matter facing our community and nation as a whole! Voter suppression is real and something that not a lot of people are aware is happening. I really appreciated the inclusion of the graph highlighting the fact that Latinos truly hold so much power in our numbers. If all of the eligible Latinos secured their vote when elections come around, I truly believe that we’d be able to make a significant change. And what better way to show up for each other and our rights than at the polls? I also thought that it was great how you provided a QR code at the bottom of your infographic so that people are able to become even more informed. Overall great job on this, it’s clear that a lot of work and effort was put in.
Lauren Sahadi
The colors were very vivid and eye catching. The infographic was slightly clustered. Some elements didn’t fit in the theme of the infographic. Other than that the information was great and the point got across clearly. I liked the layout of the information. The way you started out with if you’re eligible to vote, then statistics, then how you can change that was really nice.
Andrew Ramon
I think it’s great that your infographic is voiced so enthusiastically and encouraging. Some people can treat voting as a boring thing, but you made it seem exciting, which it is! It’s great that you provided a Spanish version of your graphic, especially after stating how important the Latino vote is. The links you provided and the QR code make it simple and easy to sign up and get registered. Awesome job Andrea.