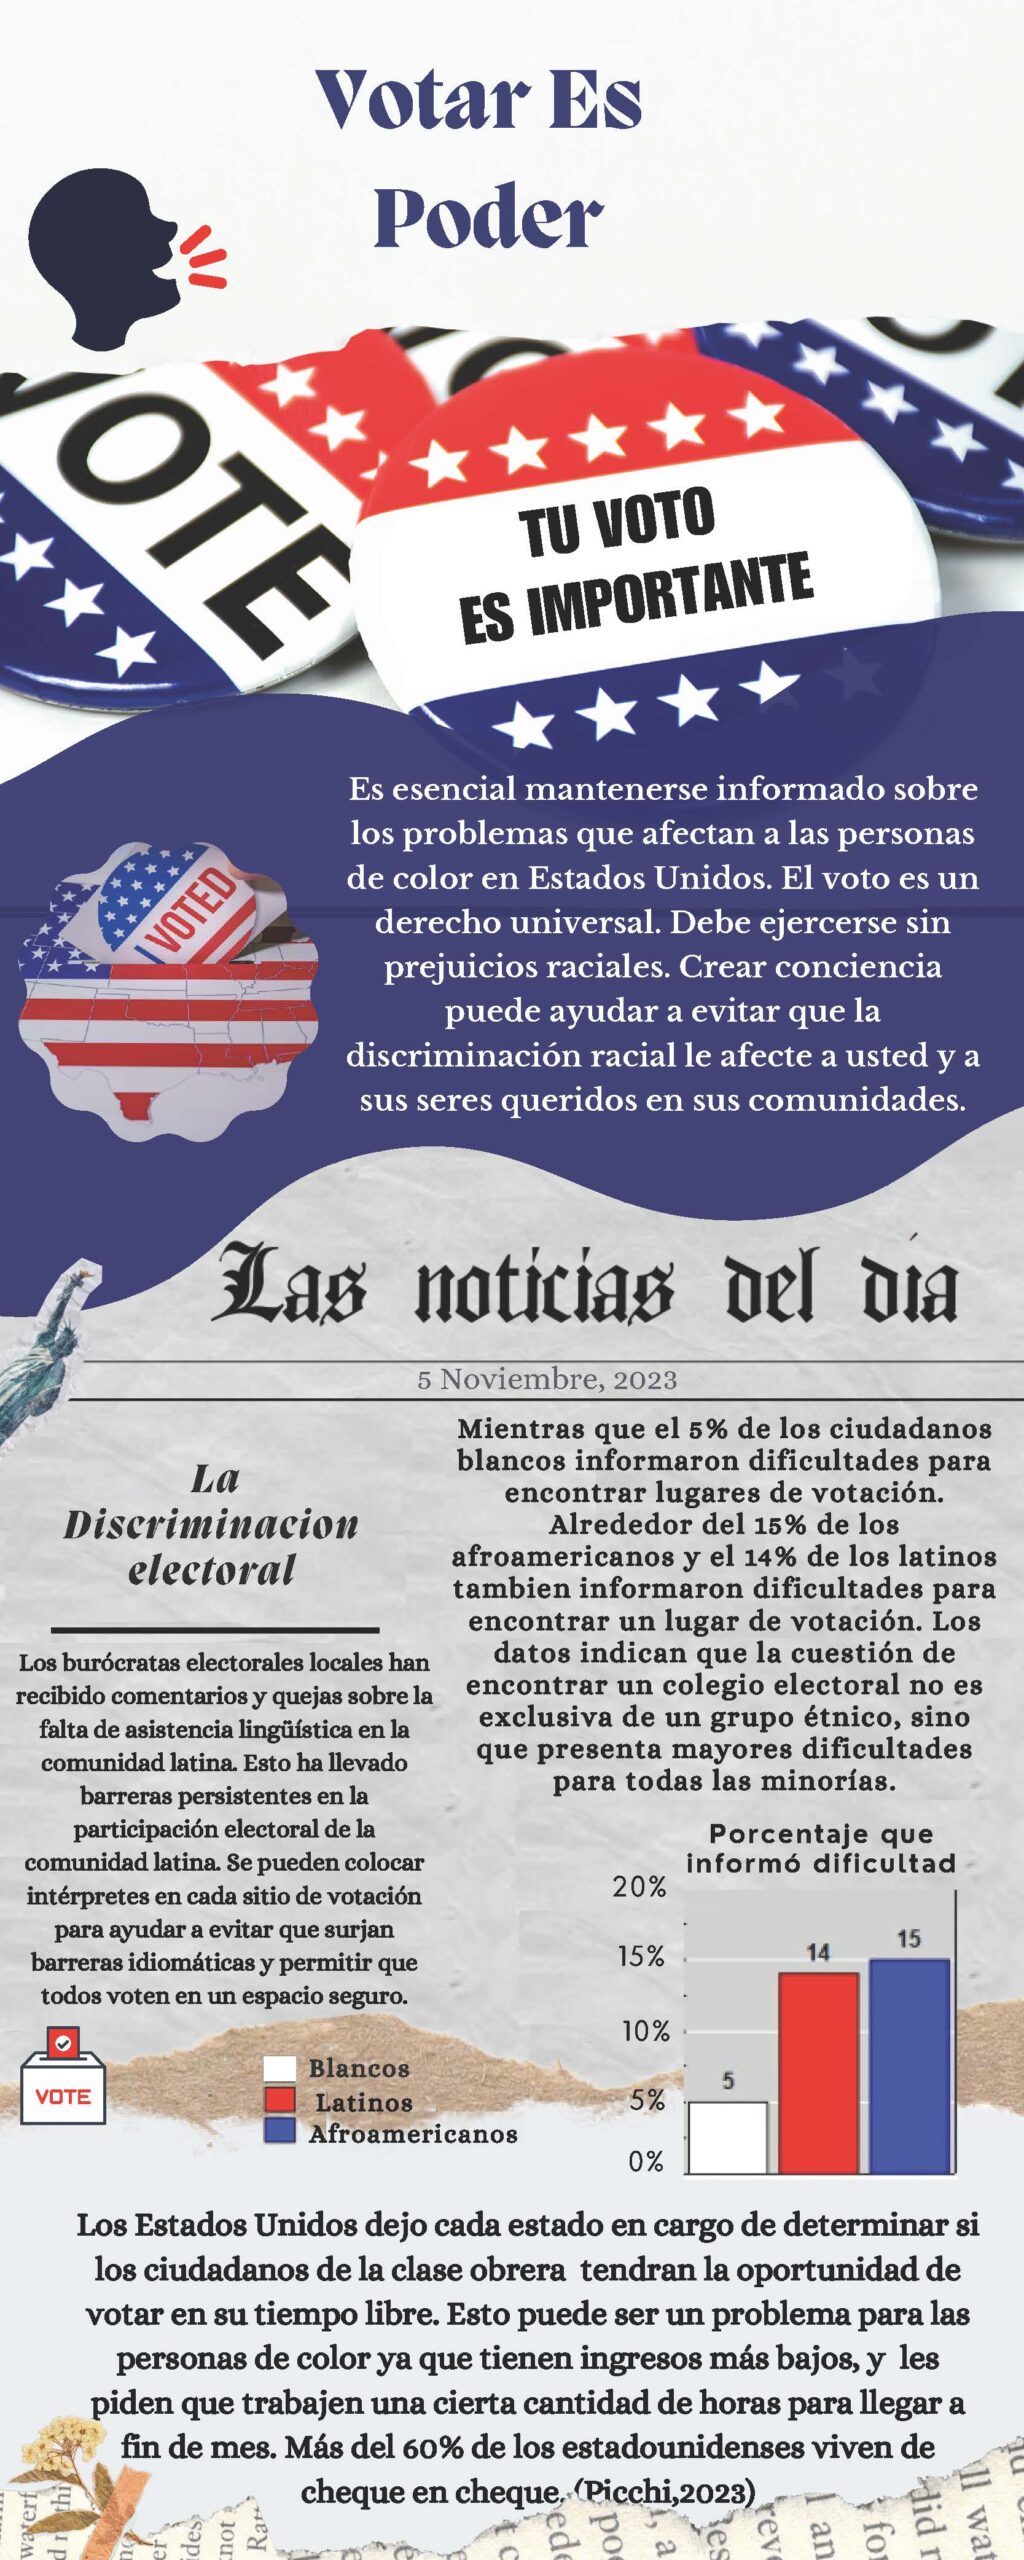
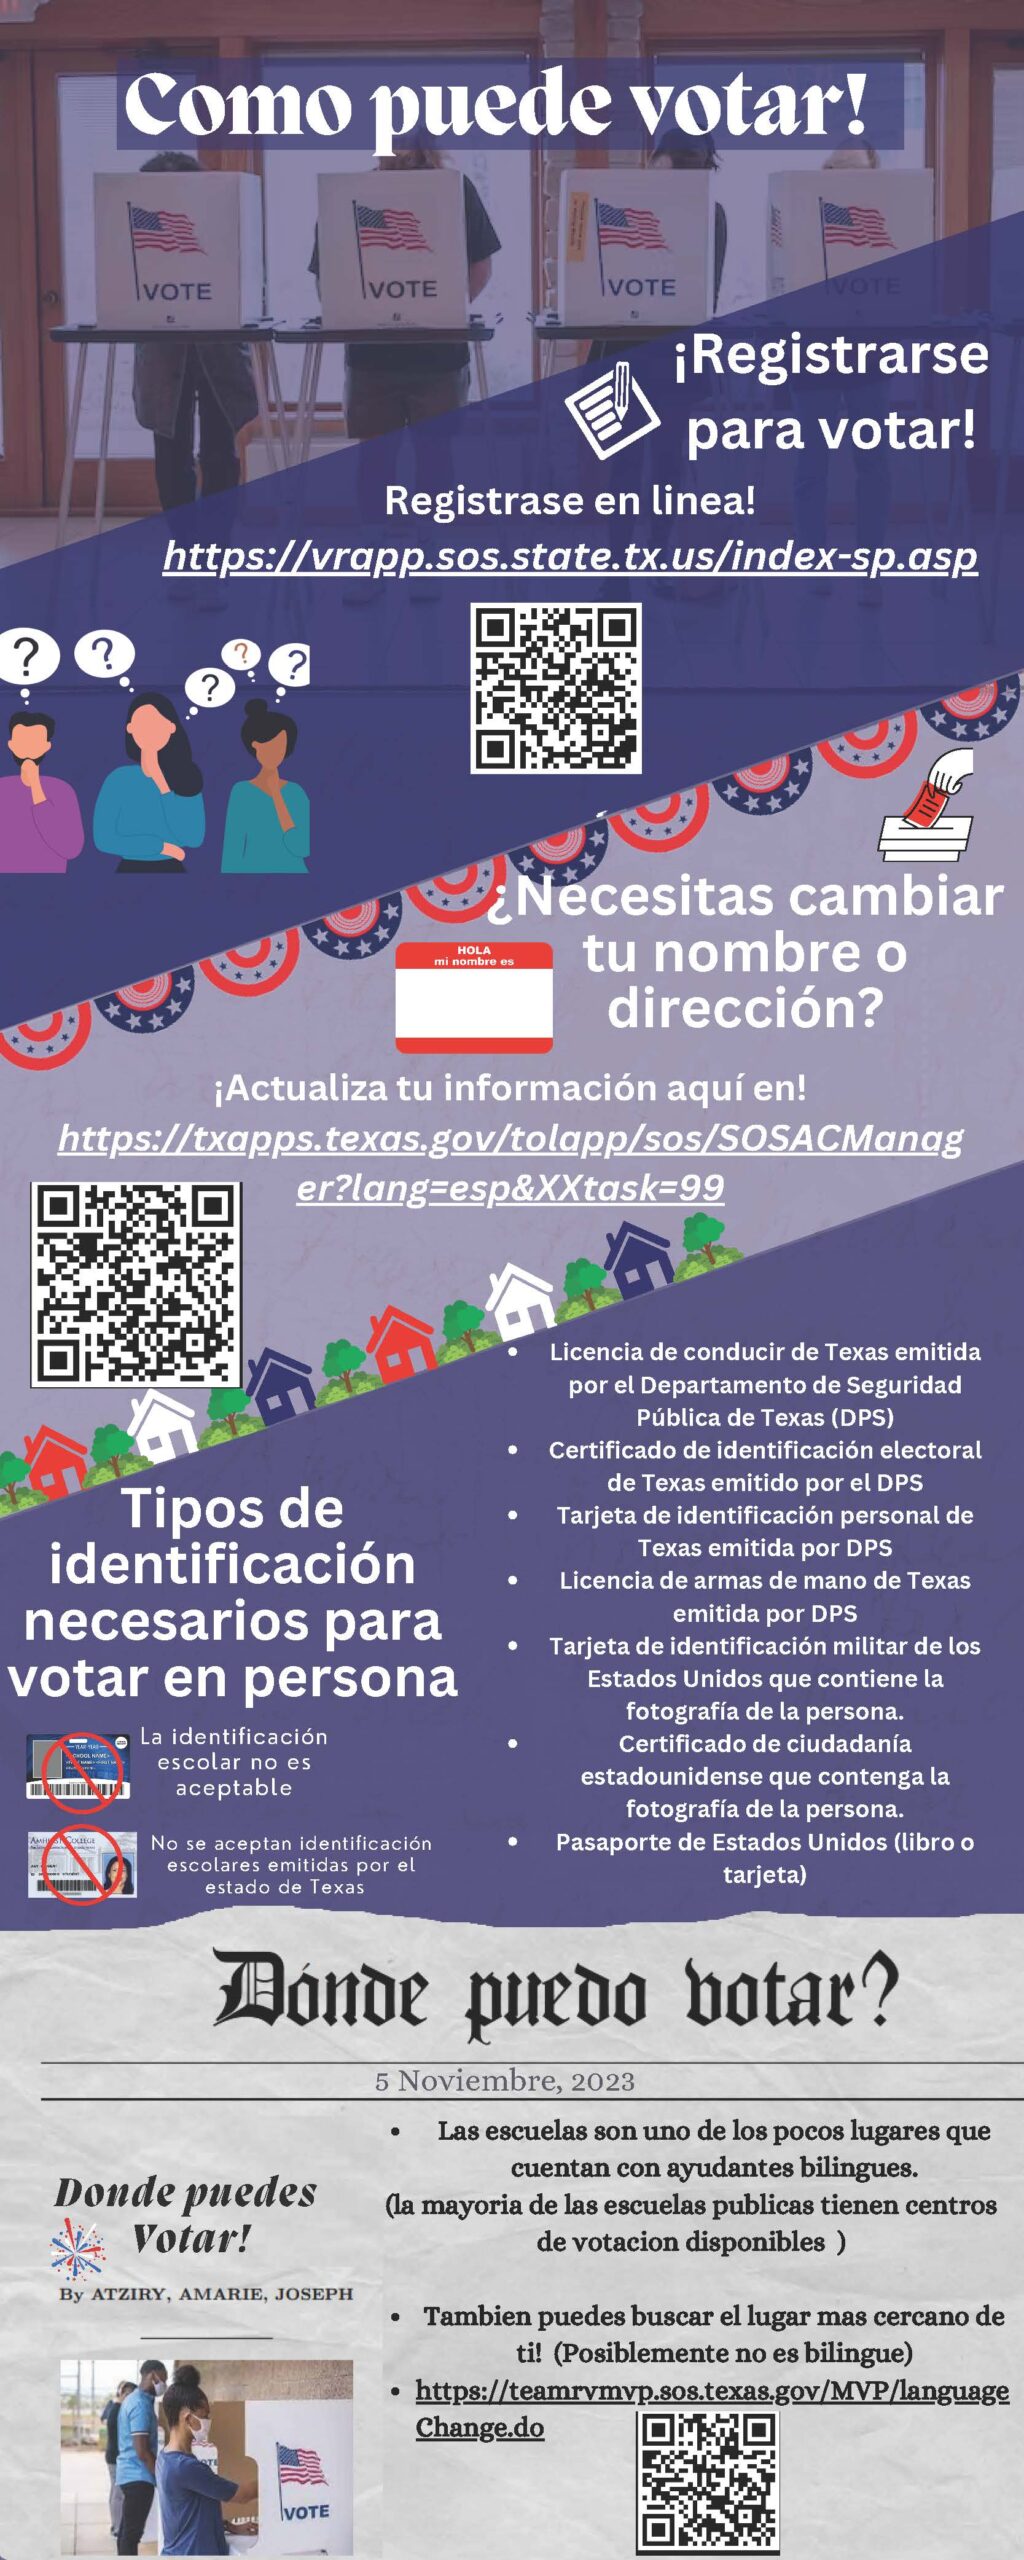
I particularly enjoy infographics that inform people on how to vote and the importance of voting. Voting can be a daunting task, and this info graphic makes the task a little less scary and more accessible. Thank you for providing data on the Latino vote, our vote matters, and to put everything in Spanish as well is also important. The theme and colors of this info graphic were perfect for the topic.
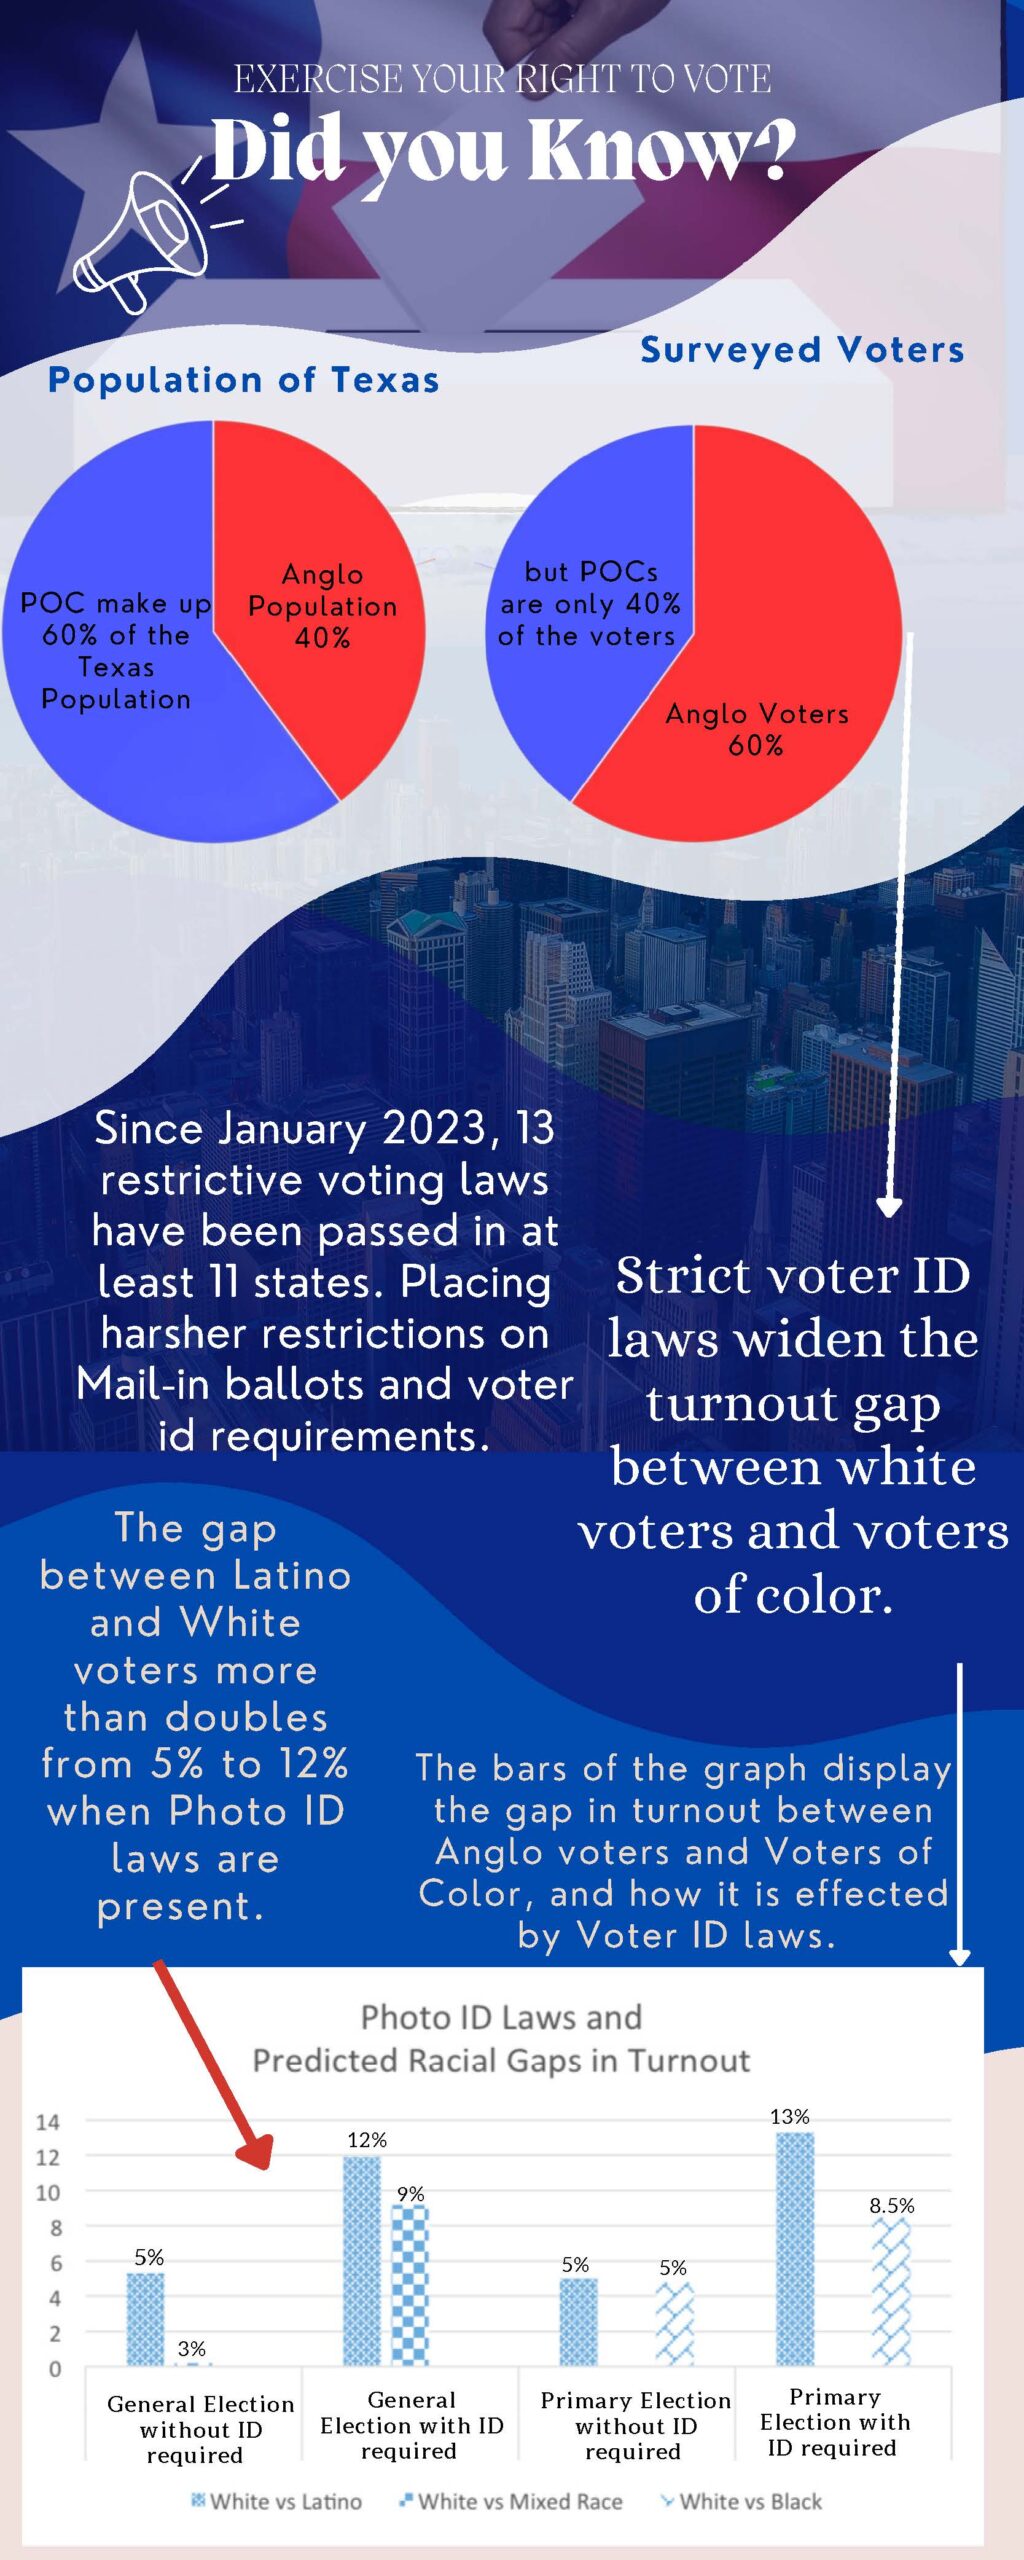
I like how the title grabs readers attention. Exercising our right to vote is very important to make sure we have the right people representing us. This infographic had the perfect amount of information to allow readers to understand the full picture without feeling overwhelmed. The visuals were a very nice touch as well as the pie charts. It helps the readers understand the data.
Wonderful use of colors and spacing in the infographic. The statistics used were very helpful and in some way vital to those who wish to learn more about voting. I enjoyed the information shared about discrimination against people of color.
Very well put together infographic great use of fonts, using the American flag colors, statistics and hitting important key points as to why certain racial groups aren’t being represented on an equal footing compared to white Americans and what laws or policies have been put in place to prevent them from being equally represented. It’s also very neat that you included a Spanish version of your infographic as well as all the information needed to get eligible to vote in this next election.
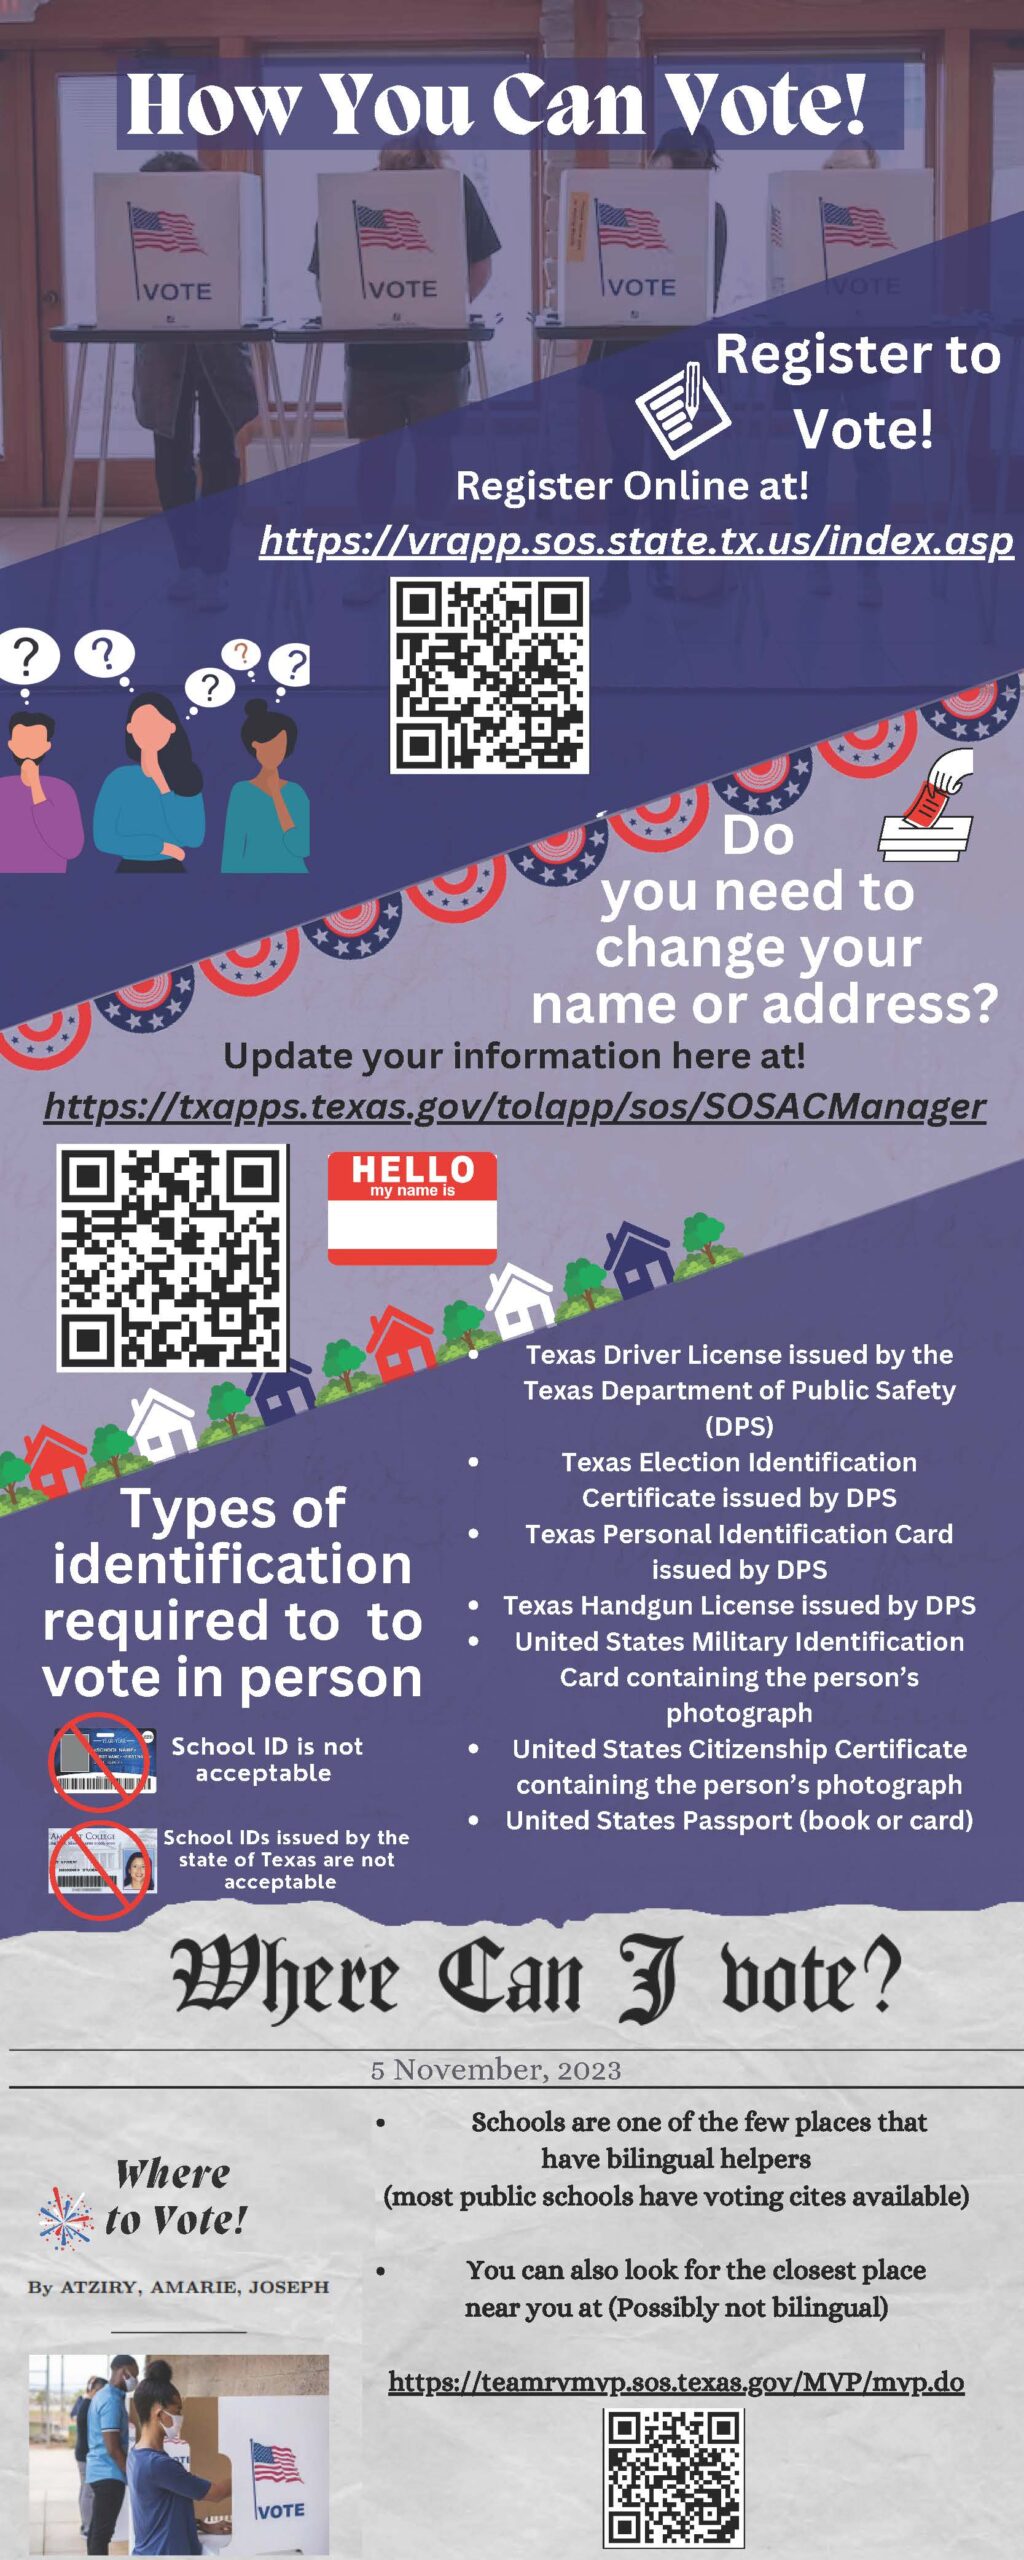
Congratulations on your nomination!! Very well deserved. This is such an amazing infographic it provides so such information about voting. Thank you for providing QR codes for easier access to the links. All of this information in this infographic is very well written and simplified.
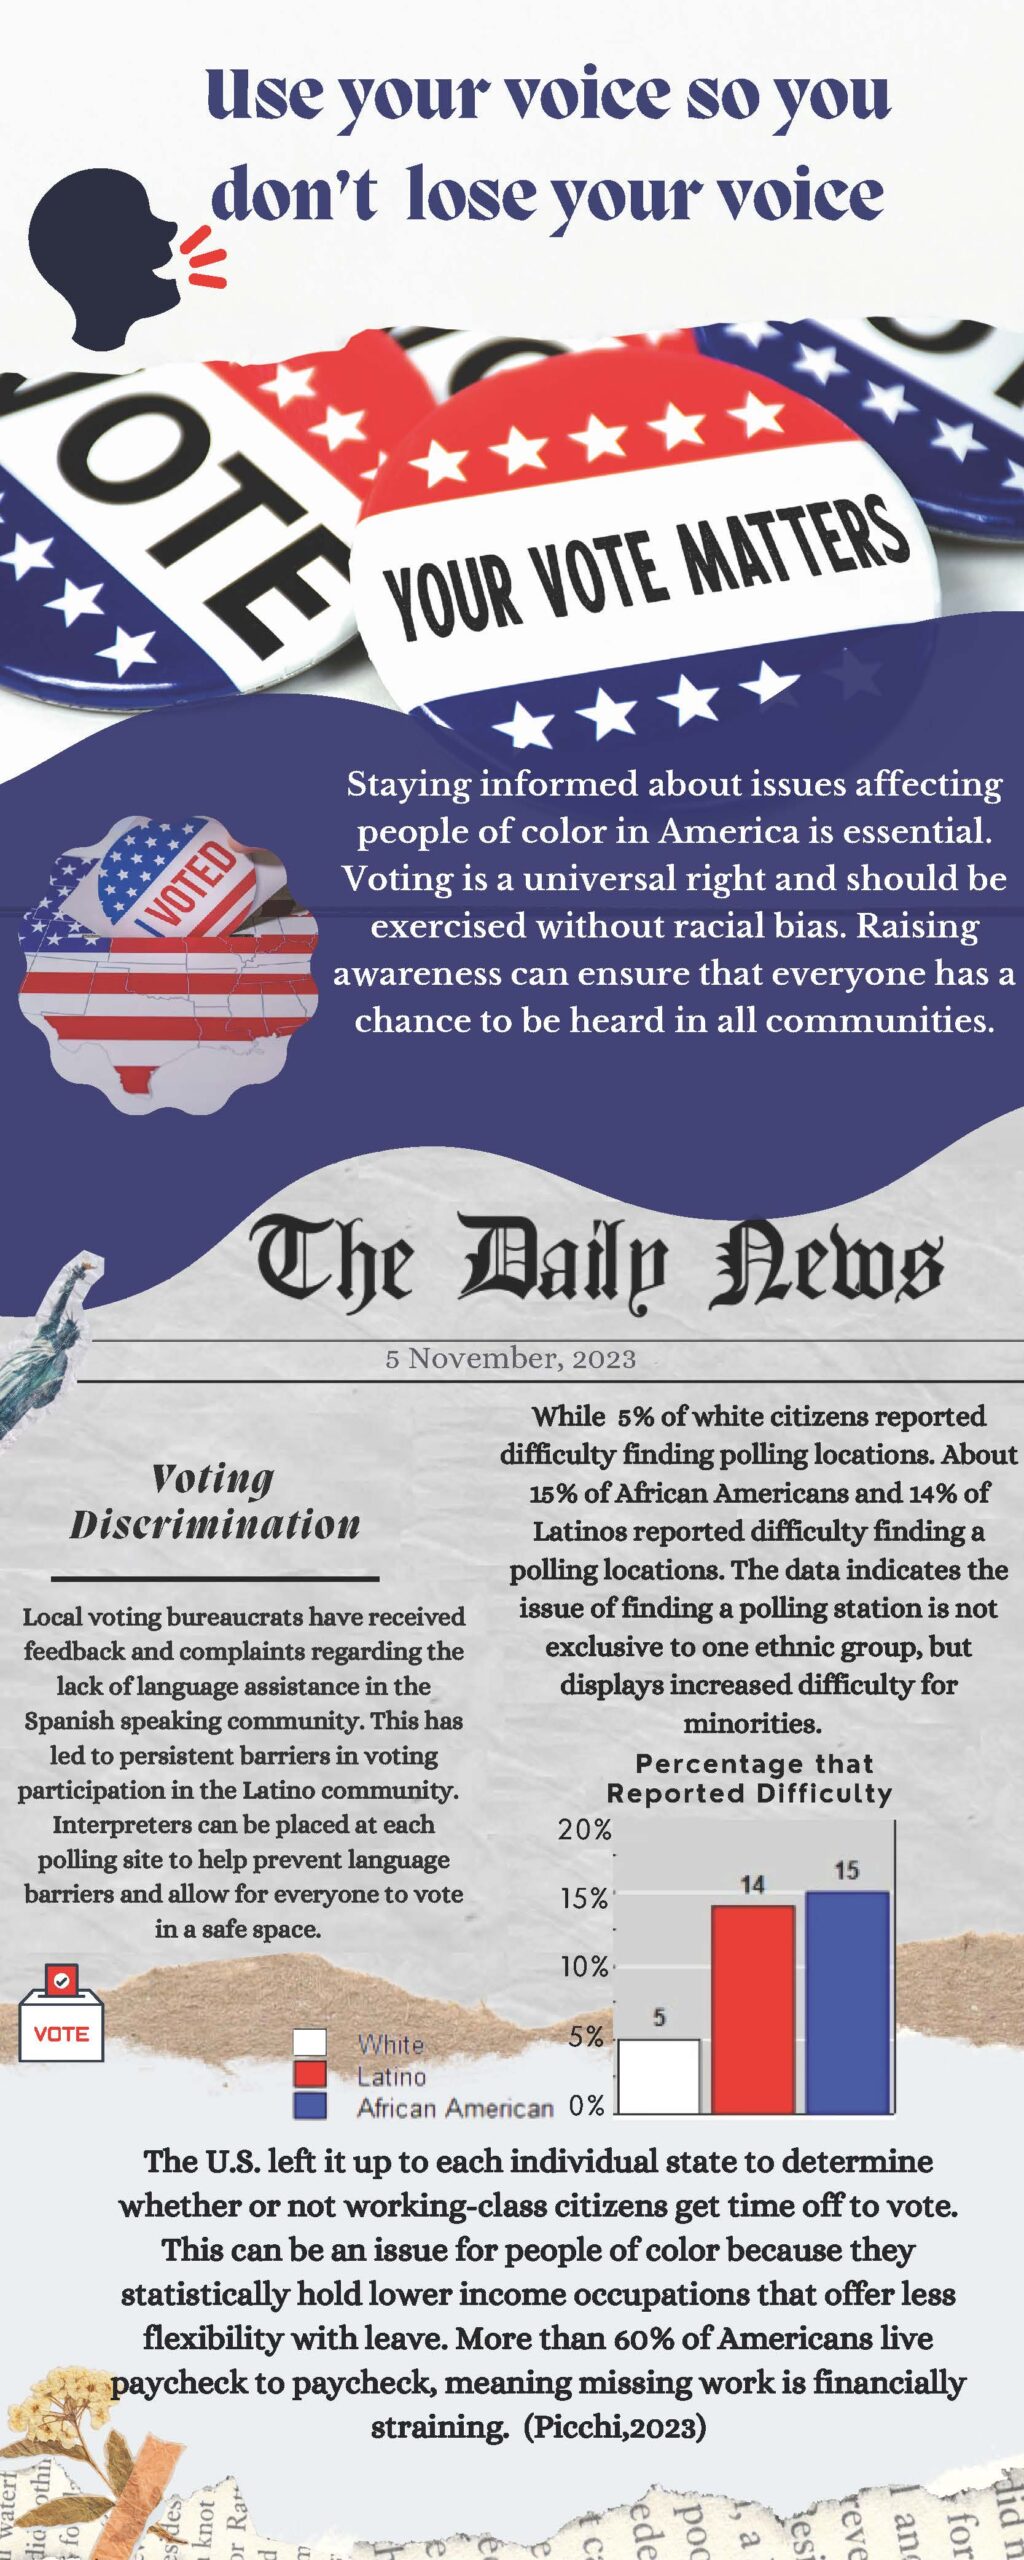
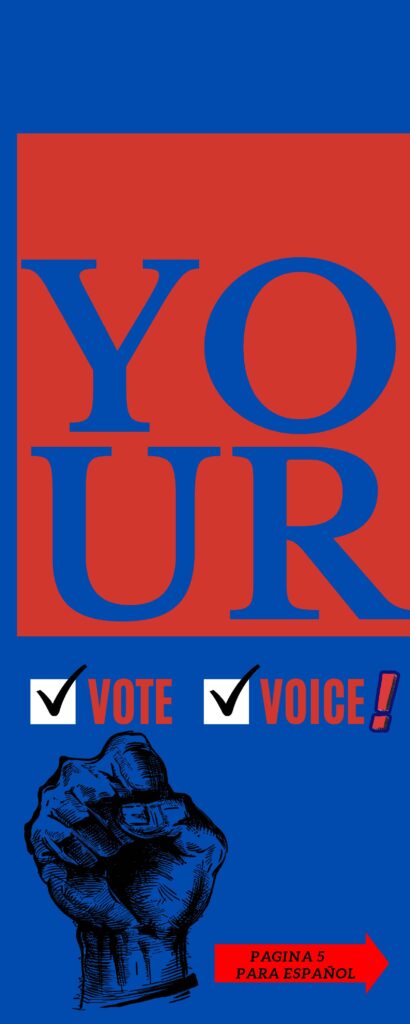
The title of the infographic stood out and was really strong, the red and blue color used in the first page was bold. I also liked how they gave information about voting discrimination and using graphs to explain their point further and make it stronger. I thought the icons fit perfectly in the infographic and the theme overall was great!
Working on this infographic was a lot of fun it allowed for me to learn more about the barriers that people of color have to deal with when it comes to voting. My group and I hope that everyone can learn from our infographic and that this can help those who are struggling to have their voice heard. Everyone deserves the right to have their voice heard!
Great infographic! I loved the color scheme red, white and blue. The infographic Your Vote Your Voice is very informative and impactful. It was direct, educational, and engaging. I admired how you utilized statistical information in a graph which made it easy for viewers to understand the information. Great job including website addresses, and the QR code. I am delighted that you are bringing attention to the required items to vote and promote action for change in Spanish. Excellent work Atziry, A’marie, and Joseph!
I think this of one of the most detailed infographics I’ve seen so far. Lots of great information and data, but presented in an easy way to follow. Everything goes well together and fits the theme. I appreciate you adding how to register to vote and making it easy to access. Atziry, Amarie, and Joseph I think y’all did a terrific job.
This infographic did a great job of providing the reader with not only vital information about how to vote but also surprising statistics on voter turnout. I found it interesting and concerning to learn that some states are making it harder for people to vote which is just outright unjust. Discriminating against minorities is a poor reflection of American values and should be spoken about as this infographic is doing amazingly.


18 comments
Mikayla Trejo
I particularly enjoy infographics that inform people on how to vote and the importance of voting. Voting can be a daunting task, and this info graphic makes the task a little less scary and more accessible. Thank you for providing data on the Latino vote, our vote matters, and to put everything in Spanish as well is also important. The theme and colors of this info graphic were perfect for the topic.
Alexis Silva
I like how the title grabs readers attention. Exercising our right to vote is very important to make sure we have the right people representing us. This infographic had the perfect amount of information to allow readers to understand the full picture without feeling overwhelmed. The visuals were a very nice touch as well as the pie charts. It helps the readers understand the data.
Silvia Benavides
Wonderful use of colors and spacing in the infographic. The statistics used were very helpful and in some way vital to those who wish to learn more about voting. I enjoyed the information shared about discrimination against people of color.
Daniel Olivares
Very well put together infographic great use of fonts, using the American flag colors, statistics and hitting important key points as to why certain racial groups aren’t being represented on an equal footing compared to white Americans and what laws or policies have been put in place to prevent them from being equally represented. It’s also very neat that you included a Spanish version of your infographic as well as all the information needed to get eligible to vote in this next election.
Johana Solís
Congratulations on your nomination!! Very well deserved. This is such an amazing infographic it provides so such information about voting. Thank you for providing QR codes for easier access to the links. All of this information in this infographic is very well written and simplified.
Ana Barrientos
The title of the infographic stood out and was really strong, the red and blue color used in the first page was bold. I also liked how they gave information about voting discrimination and using graphs to explain their point further and make it stronger. I thought the icons fit perfectly in the infographic and the theme overall was great!
Amarie Pollard
Working on this infographic was a lot of fun it allowed for me to learn more about the barriers that people of color have to deal with when it comes to voting. My group and I hope that everyone can learn from our infographic and that this can help those who are struggling to have their voice heard. Everyone deserves the right to have their voice heard!
Linda Aguilar
Great infographic! I loved the color scheme red, white and blue. The infographic Your Vote Your Voice is very informative and impactful. It was direct, educational, and engaging. I admired how you utilized statistical information in a graph which made it easy for viewers to understand the information. Great job including website addresses, and the QR code. I am delighted that you are bringing attention to the required items to vote and promote action for change in Spanish. Excellent work Atziry, A’marie, and Joseph!
Andrew Ramon
I think this of one of the most detailed infographics I’ve seen so far. Lots of great information and data, but presented in an easy way to follow. Everything goes well together and fits the theme. I appreciate you adding how to register to vote and making it easy to access. Atziry, Amarie, and Joseph I think y’all did a terrific job.
Andrea Realyvasquez
This infographic did a great job of providing the reader with not only vital information about how to vote but also surprising statistics on voter turnout. I found it interesting and concerning to learn that some states are making it harder for people to vote which is just outright unjust. Discriminating against minorities is a poor reflection of American values and should be spoken about as this infographic is doing amazingly.