Haley is a researcher and Political Science Major at St. Mary’s University. She enjoys understanding and learning legal processes and shedding light on the importance of civic engagement.
I like this infographic so much. There are kind explanation about why we should vote. I love voting too. After reading this I felt more like to vote often. Voting is not only just giving opinion it is also expressing ourselves to society. I like the QR code given in this infographic too. I appreciate it for your effort and have a good day.
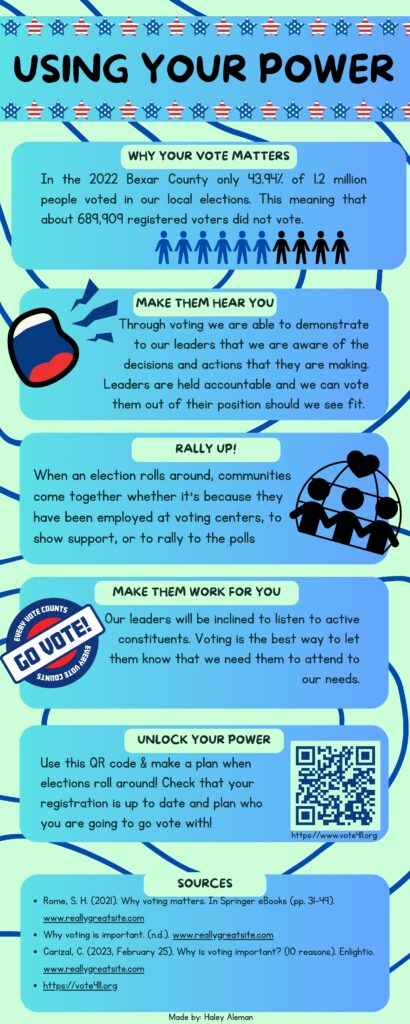
Thank you for placing at this is on the amount of people who did not vote. December will hopefully encourage more individuals to vote as it is an important activity in community engagement. I appreciate how you provided the QR code. This made the task seem even more accessible. Great infographic, thank you for the information.
I really like the colors and how the titles of each section are capitalized. This helps readers understand the topic better by breaking into sections. The visuals in each section help add to their understanding as well. This infographic was structured nicely and helps shed light on we can make use of our voice and right to vote.
I absolutely love the theme of your infographic. It was easy to understand and read and well put together. The graphics were helpful and nice to look at, but I wish pictures were included. I believe they could have helped visual learners. Great Job Haley!
Hello Haley that opening statistic really drives home the importance of why your vote matters when less than half of registered voters vote it’s almost like your voting for 2 people. Helpful QR Code , well organized sources, good use of color and well laid out information without it being overcrowded, icons used to demonstrate points made, as well as the infographic was easy to read and to the point.
“Using your Power” is such a good title it really caught my attention. Loved the little stars around the title. This infographic is very straight to the point which can be helpful especially in the topic of voting. The subtitles are very eye catching and can easily find information on what someone is looking for. Although it is a good infographic, I do wish it had more information on different ways to rally up and how to promote more voting.
I loved the title of this infographic “Using Your Power”, it caught my attention and made me want to read more. The blue, greenish colors made it fun to look at. I also enjoyed the facts that were given in the beginning, the QR code was interesting because it gives the reader a faster way to go to the website and learn more. Overall, great job!
I liked your infographic I would have liked to see more information.
1.) Who was not voting the most based on gender, age, race? —> that would give the reader more context and target a specific audience
2.) Bring up solutions to issues –> if you didn’t vote this reason because you couldn’t find a place to vote or … you can do this next time to be better prepared
3.) Pictures are also good ways to get a point across. I liked the graphics but pictures would’ve been nice too.
I loved the color scheme. The infographic Using Your Power is very informative and impactful. It was direct, educational, and engaging. Excellent job, including website addresses, and the QR code. I am delighted that you are addressing Why Your Vote Matters. The infographic featured topics such as Make Them Hear You and Rally Up, a call to action. Good job Haley.
This infographic was such an easy and effective read which I feel is extremely important when reading about vital topics such as voting. When speaking on this topic it’s so important to give information as easily as possible because of the impact it can have on communities who need it. The power we hold as the public to elect leaders who support the community’s beliefs is our responsibility to seek out.


19 comments
LEE
I like this infographic so much. There are kind explanation about why we should vote. I love voting too. After reading this I felt more like to vote often. Voting is not only just giving opinion it is also expressing ourselves to society. I like the QR code given in this infographic too. I appreciate it for your effort and have a good day.
Mikayla Trejo
Thank you for placing at this is on the amount of people who did not vote. December will hopefully encourage more individuals to vote as it is an important activity in community engagement. I appreciate how you provided the QR code. This made the task seem even more accessible. Great infographic, thank you for the information.
Alexis Silva
I really like the colors and how the titles of each section are capitalized. This helps readers understand the topic better by breaking into sections. The visuals in each section help add to their understanding as well. This infographic was structured nicely and helps shed light on we can make use of our voice and right to vote.
Silvia Benavides
I absolutely love the theme of your infographic. It was easy to understand and read and well put together. The graphics were helpful and nice to look at, but I wish pictures were included. I believe they could have helped visual learners. Great Job Haley!
Daniel Olivares
Hello Haley that opening statistic really drives home the importance of why your vote matters when less than half of registered voters vote it’s almost like your voting for 2 people. Helpful QR Code , well organized sources, good use of color and well laid out information without it being overcrowded, icons used to demonstrate points made, as well as the infographic was easy to read and to the point.
Johana Solís
“Using your Power” is such a good title it really caught my attention. Loved the little stars around the title. This infographic is very straight to the point which can be helpful especially in the topic of voting. The subtitles are very eye catching and can easily find information on what someone is looking for. Although it is a good infographic, I do wish it had more information on different ways to rally up and how to promote more voting.
Ana Barrientos
I loved the title of this infographic “Using Your Power”, it caught my attention and made me want to read more. The blue, greenish colors made it fun to look at. I also enjoyed the facts that were given in the beginning, the QR code was interesting because it gives the reader a faster way to go to the website and learn more. Overall, great job!
Amarie Pollard
I liked your infographic I would have liked to see more information.
1.) Who was not voting the most based on gender, age, race? —> that would give the reader more context and target a specific audience
2.) Bring up solutions to issues –> if you didn’t vote this reason because you couldn’t find a place to vote or … you can do this next time to be better prepared
3.) Pictures are also good ways to get a point across. I liked the graphics but pictures would’ve been nice too.
good job!
Linda Aguilar
I loved the color scheme. The infographic Using Your Power is very informative and impactful. It was direct, educational, and engaging. Excellent job, including website addresses, and the QR code. I am delighted that you are addressing Why Your Vote Matters. The infographic featured topics such as Make Them Hear You and Rally Up, a call to action. Good job Haley.
Andrea Realyvasquez
This infographic was such an easy and effective read which I feel is extremely important when reading about vital topics such as voting. When speaking on this topic it’s so important to give information as easily as possible because of the impact it can have on communities who need it. The power we hold as the public to elect leaders who support the community’s beliefs is our responsibility to seek out.